First examples
Simple Line Chart
Let's look at a very basic XY data visualization use case to get first contact with LightningChart concepts.
import lightningchart as lc

lc.set_license('my-license-key')

x = [1, 2, 3, 4, 5, 6, 7, 8, 9, 10]
y = [2, 1, 4, 3, 6, 5, 8, 7, 10, 9]

chart = lc.LineChart(
    title='My Line Chart',
    theme=lc.Themes.White,
)
chart.add(x, y)
chart.open()
Charts are created using the lightningchart/lc reference.
A LineChart is created and its reference is stored to variable chart.
Inside the chart constructor, a title and visual theme are defined.
LineChart is example of a "declarative API" chart, (see Programming APIs).
x and y data points are added to the chart by chart.add(x, y).
There are multiple ways of adding data to the charts.
Finally, the chart is opened by chart.open().
For more display options, see Displaying charts.
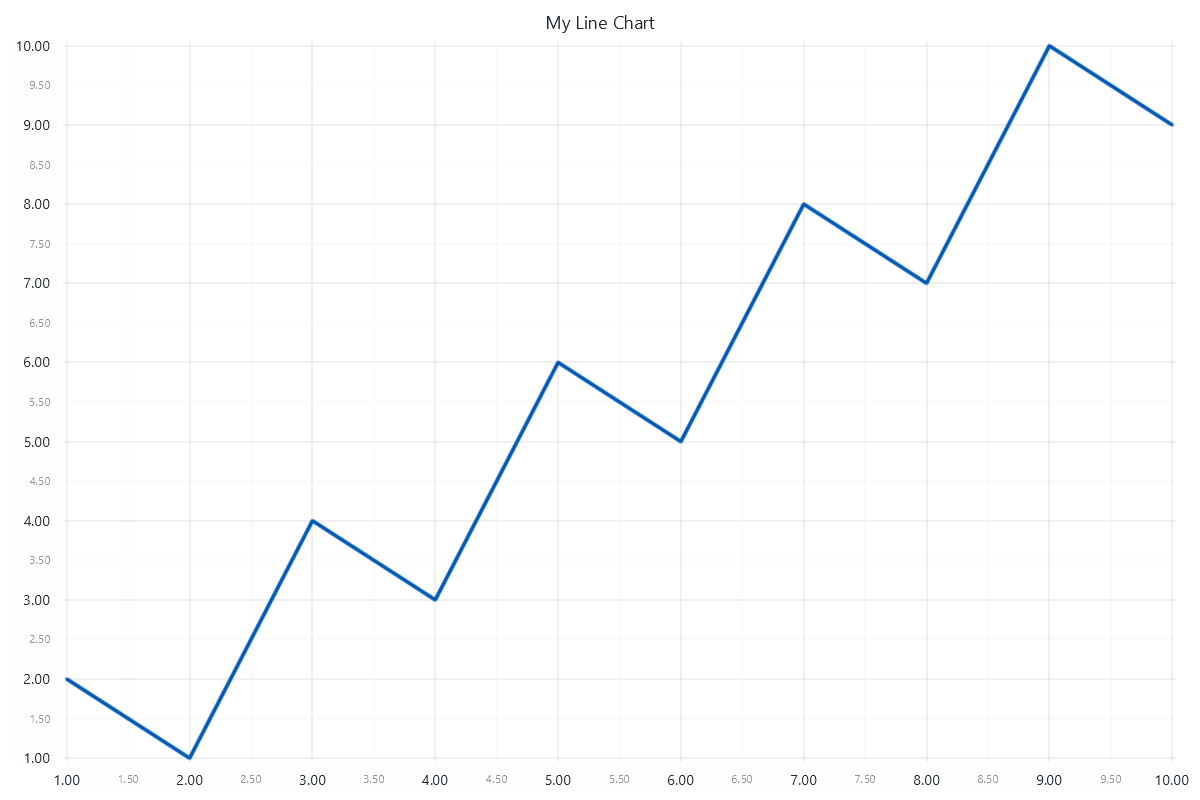
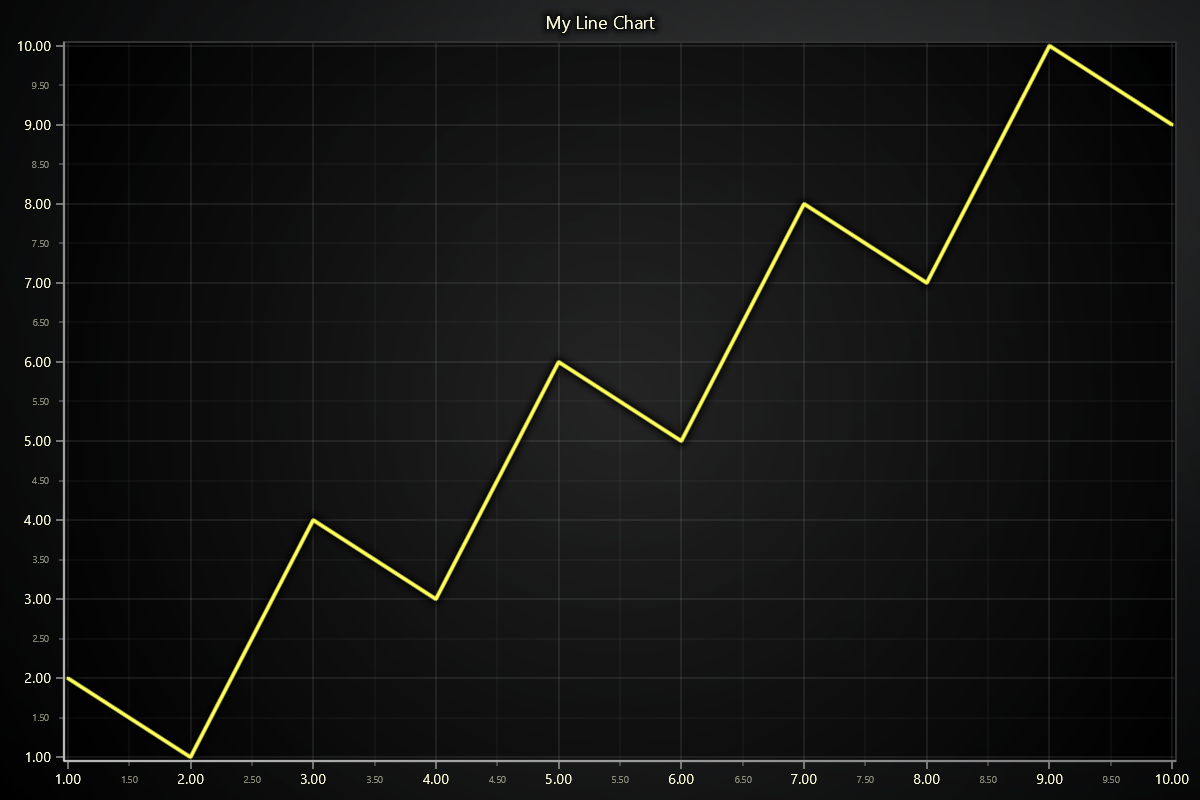
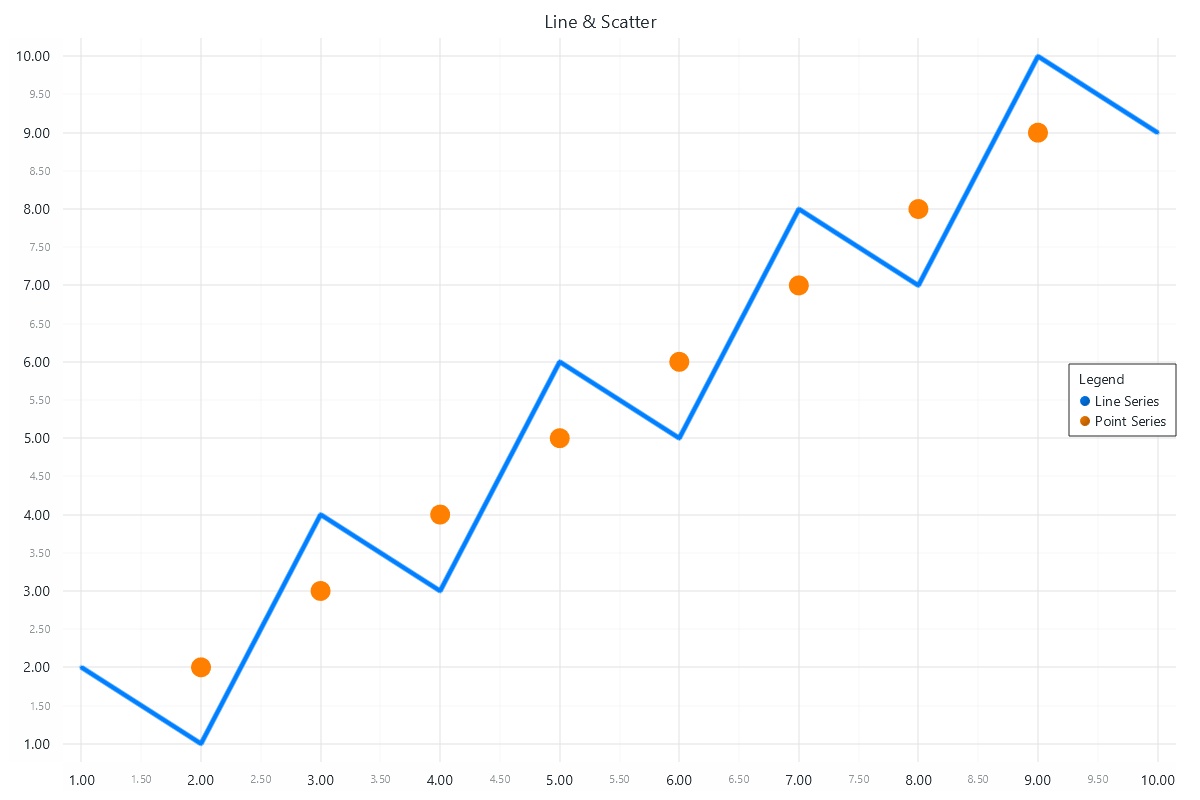
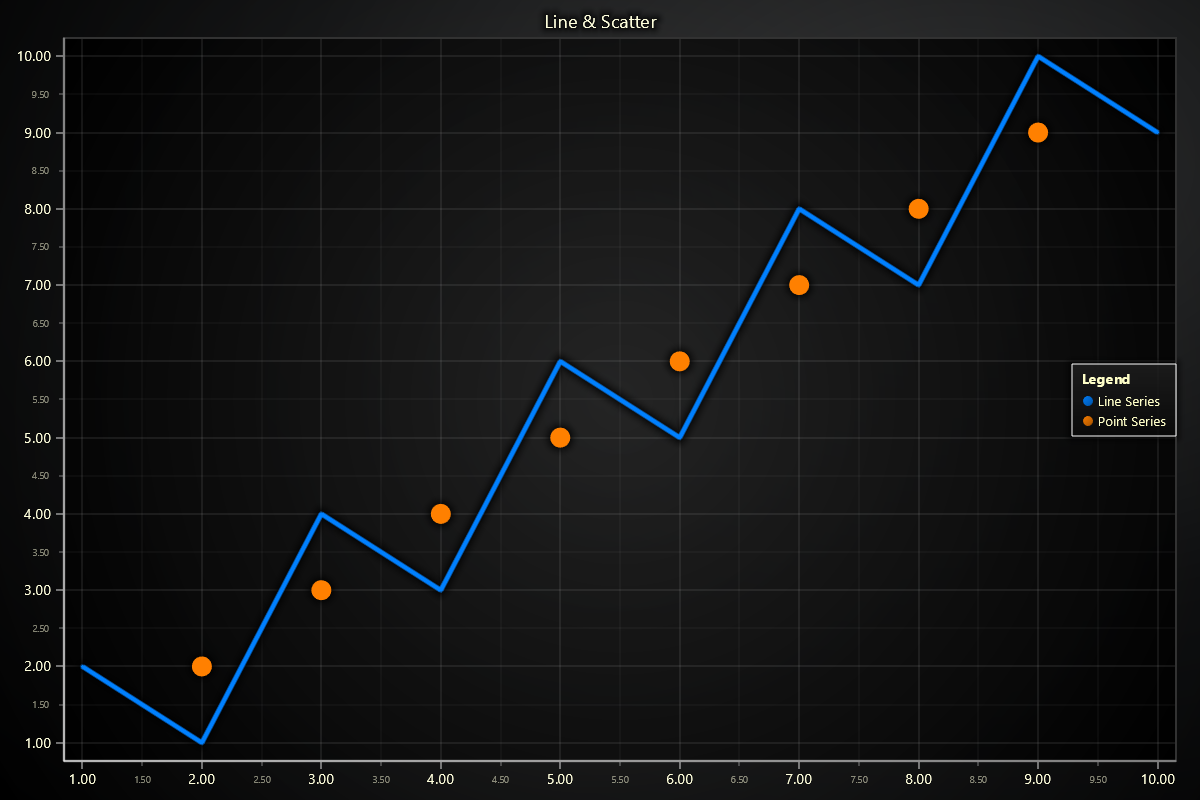
Chart with multiple visualization types (Line & Scatter)
import lightningchart as lc

lc.set_license('my-license-key')

# Two different ways of defining data:
# List of numbers
x = [1, 2, 3, 4, 5, 6, 7, 8, 9, 10]
y = [2, 1, 4, 3, 6, 5, 8, 7, 10, 9]
# List of dictionaries containing number values for x and y keys
scatter_points = [
    {"x": 2, "y": 2},
    {"x": 3, "y": 3},
    {"x": 4, "y": 4},
    {"x": 5, "y": 5},
    {"x": 6, "y": 6},
    {"x": 7, "y": 7},
    {"x": 8, "y": 8},
    {"x": 9, "y": 9},
]

# Initialize the chart
chart = lc.ChartXY(
    title='Line & Scatter',
    theme=lc.Themes.White,
)

# Add a line series to display line
line_series = chart.add_line_series()
line_series.add(x, y)
line_series.set_line_color(lc.Color(0, 128, 255))
line_series.set_line_thickness(5)

# Add a point series to display scatter points
point_series = chart.add_point_series()
point_series.add(scatter_points)
point_series.set_point_color(lc.Color(255, 128, 0))
point_series.set_point_size(20)

# Add a legend to the chart (optional)
legend = chart.add_legend(data=chart)

# Display the chart
chart.open()
For a list of available charts, see Charts.