LightningChart .NETDigital Signal Processing Filters Application
TutorialCreate a charting application for processing signal data and implement IIR and FIR filters
Digital Signal Processing Filters Application
A digital signal processing filters application may not be the typical charting application but is rather a more complex and powerful type of signal data chart control. This type of charting control is useful for improving the quality and integrity of the signal data processed. In practice, there are several applications examples, here’s an example:
Audio Processing and Telcom systems: It is common that filters for digital signals are used for, e.g., removing background noise or improving frequencies. In this industry, a digital signal processing filters application processes signal data and allows users to apply different filters for improving the signal data received.
Project Overview
Signal Filters are programmatic filters made to filter out unwanted frequencies from the acquired signal data. With these controls, we will be able to manipulate the amplitude, range of frequency, duration, and spectrum length.
Also, we will be able to use finite and infinite impulse response FIR and IIR digital signal processing filters. For this example, we will work with XY charts that will be affected by the available filters.
Download the project to follow the tutorial
Local Setup
For this project, we need to take into count the following requirements to compile the project.
- OS: 32-bit or 64-bit Windows Vista or later, Windows Server 2008 R2 or later.
- DirectX: 9.0c (Shader model 3 and higher) or 11.0 compatible graphics adapter.
- Visual Studio: 2010-2019 for development, not required for deployment.
- Platform .NET Framework: installed version 4.0 or newer.
Now go to the next URL and download LightningChart .NET. You’ll then be redirected to a sign-in form where you’ll have to complete a simple sign-up process. When you’re done with the registration process, you’ll have access to your LightningChart account.
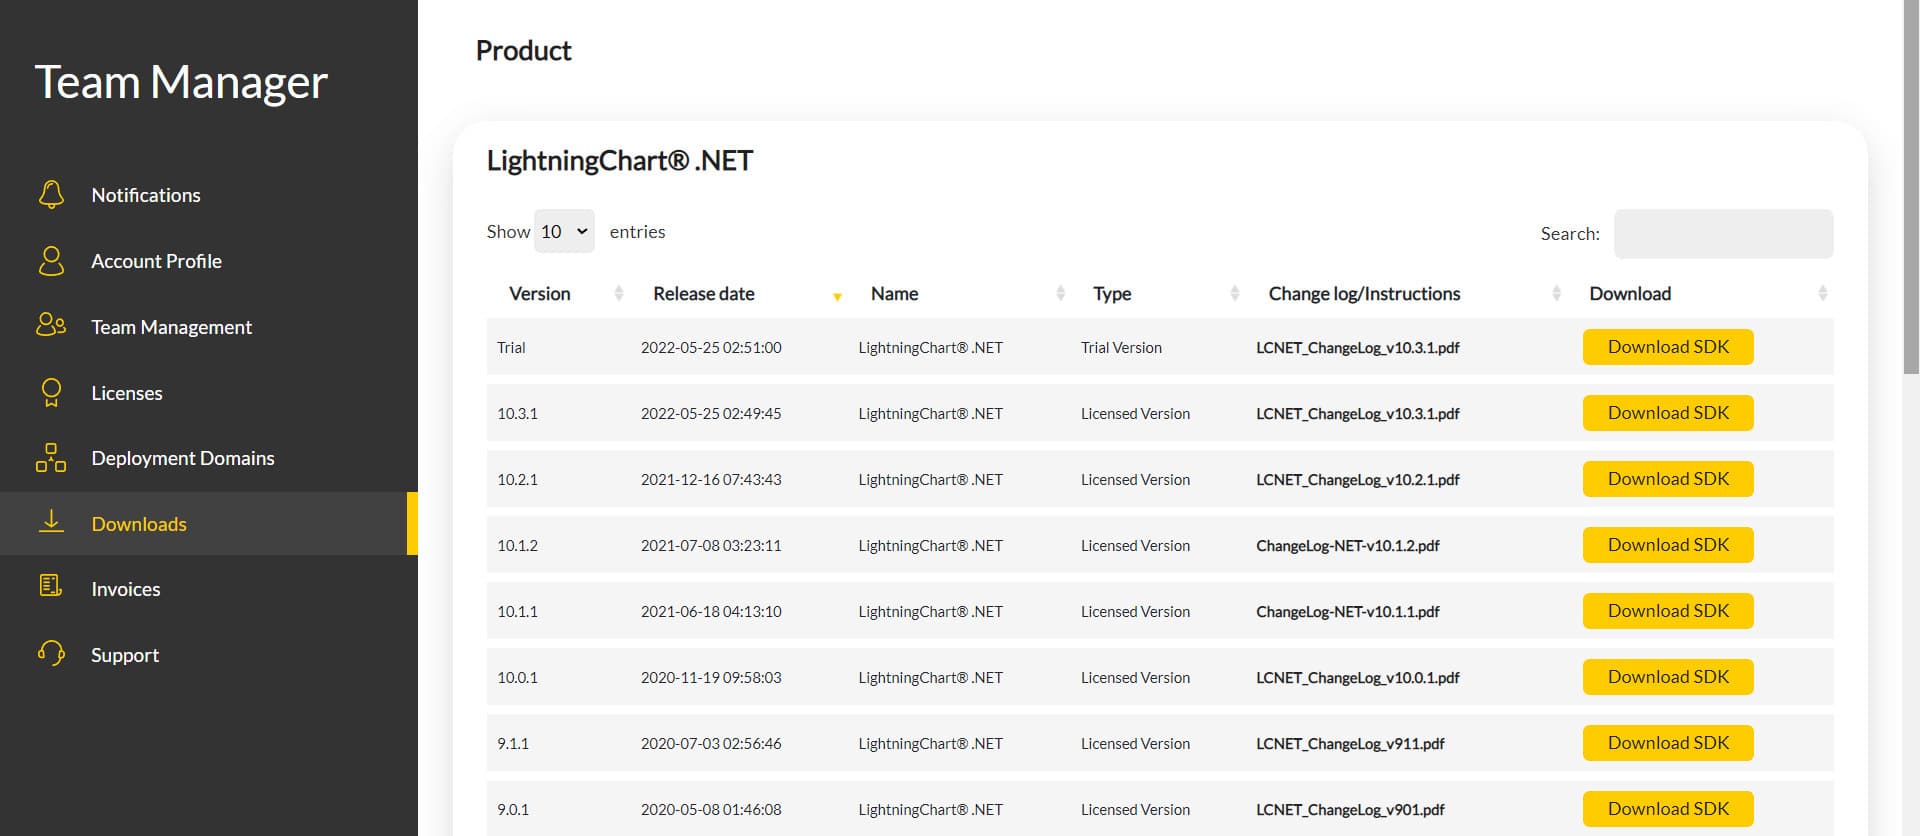
After you sign into your account, you will be able to download the SDK. This SDK will be a “free trial” version, but you will be able to use many important features for this Digital Signal Processing Filters App tutorial. When you download the SDK, you’ll have a .exe file like this:

The installation will be a typical Windows process, so please continue with it until it is finished. After the installation, you will see the following programs:

License Manager
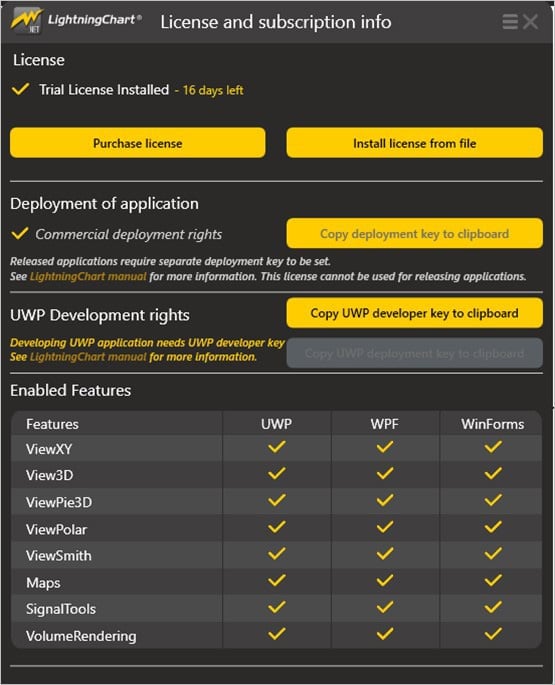
In this application, you will see the purchase options. All the projects that you will create with this trial SDK, will be available for future developments with all features enabled.
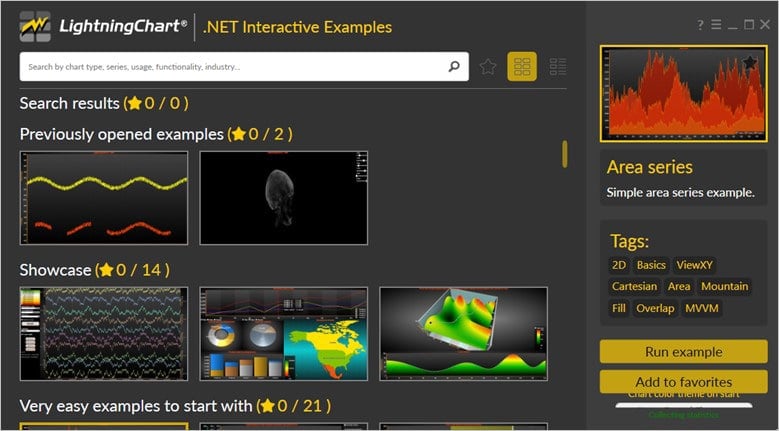
LightningChart .NET Interactive Examples
Now you can see 100+ interactive visualizations available for WPF, WinForms, and/or UWP.
Visual Studio Project
Now let’s work with Visual Studio. The main difference between using the LightningChart visualizer and Visual Studio is that we will be able to analyze and experiment with many features within the source code. In the LC visualizer, select the Digital Signal Processing Filters app and run the example:

In the top-right zone of the windows, you will see the following options:
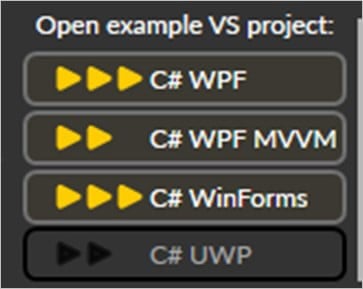
For the trial SDK, we will be able to use the WPF framework. After clicking the framework to use, we will need to specify a folder where the project will be created:
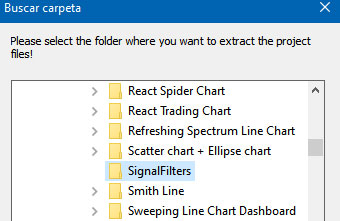
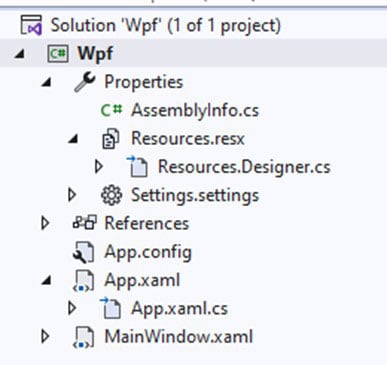
Finally, the project will be created and Visual Studio will be opened and ready for executing the digital signal processing filters application.
Code Review
The main code will be wrapped inside MainWindow.xaml.cs. Here we will find the code for UI controls.
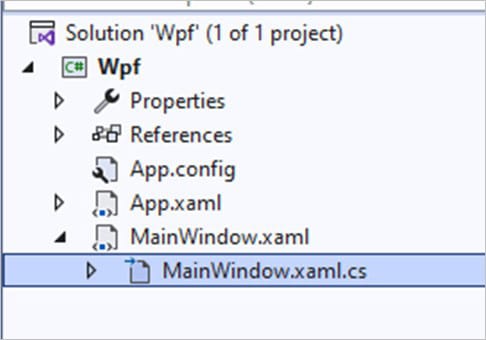
Inside the code, we will check two methods that will create the properties that we need to correctly draw the chart. The interactive example is built with various user controls, to manipulate and change the visual properties of the chart. These controls are not required to generate this graph, so we will focus on the code responsible for generating the object.
Initial Setup
InitializeComponent();
            //Generate Signal generator, filters and spectrum
            _SignalGenerator = new SignalGenerator();
            _SignalGenerator.ThreadType = ThreadType.Thread;
            _SignalGenerator.OutputInterval = 0;
            _IIRFilter = new IIRFilter();
            _FIRFilter = new FIRFilter();
            _spectrumCalculator = new SpectrumCalculator();
            _FIRFilter.SetFactors(_FirLowPass);
The initializeComponent() will load the XAML file that will help us to display our chart object. The SignalGenerator instance will help us to create the signal object that will be displayed in the digital signal processing filters application.
The signal object will contain properties like sampling frequency, output interval, and waveform components. The outputInterval gets or sets the output interval of this signal generator in milliseconds.
The threadType gets or sets the way how data is generated. It generates data either by using a thread or a main UI thread synchronized timer. The IIRFilter/FIRFilter are the constructors that we will use to create the filters with the same name.
SpectrumCalculator converts signal data (time domain) to a spectrum (frequency domain) by using FFT (Fast Fourier Transform). The Spectrum Calculator also contains different methods for backward conversions and frequency domain to the time domain.
The SetFactors function sets the analog filters to our FIR Filter. In the case of FIR filters, the analog filters only contain zeros. To create analog filters, it is necessary to have extensive mathematical knowledge.
For this example, we will have the default values inside an array.
CreateChart()
This main method is responsible for creating the chart object. We begin by creating a new instance of LightningChart and giving the chart a name.
Naming the chart object
_ChartArea.BeginUpdate();
_Chart.BeginUpdate();


            _Chart.ViewXY.XAxes[0].ScrollMode = XAxisScrollMode.Scrolling;
            _Chart.ViewXY.XAxes[0].ZoomingEnabled = true;
            _Chart.ViewXY.XAxes[0].PanningEnabled = true;
            _Chart.ViewXY.XAxes[0].SetRange(-1.0, 0);
            _Chart.ViewXY.XAxes[0].Visible = false;
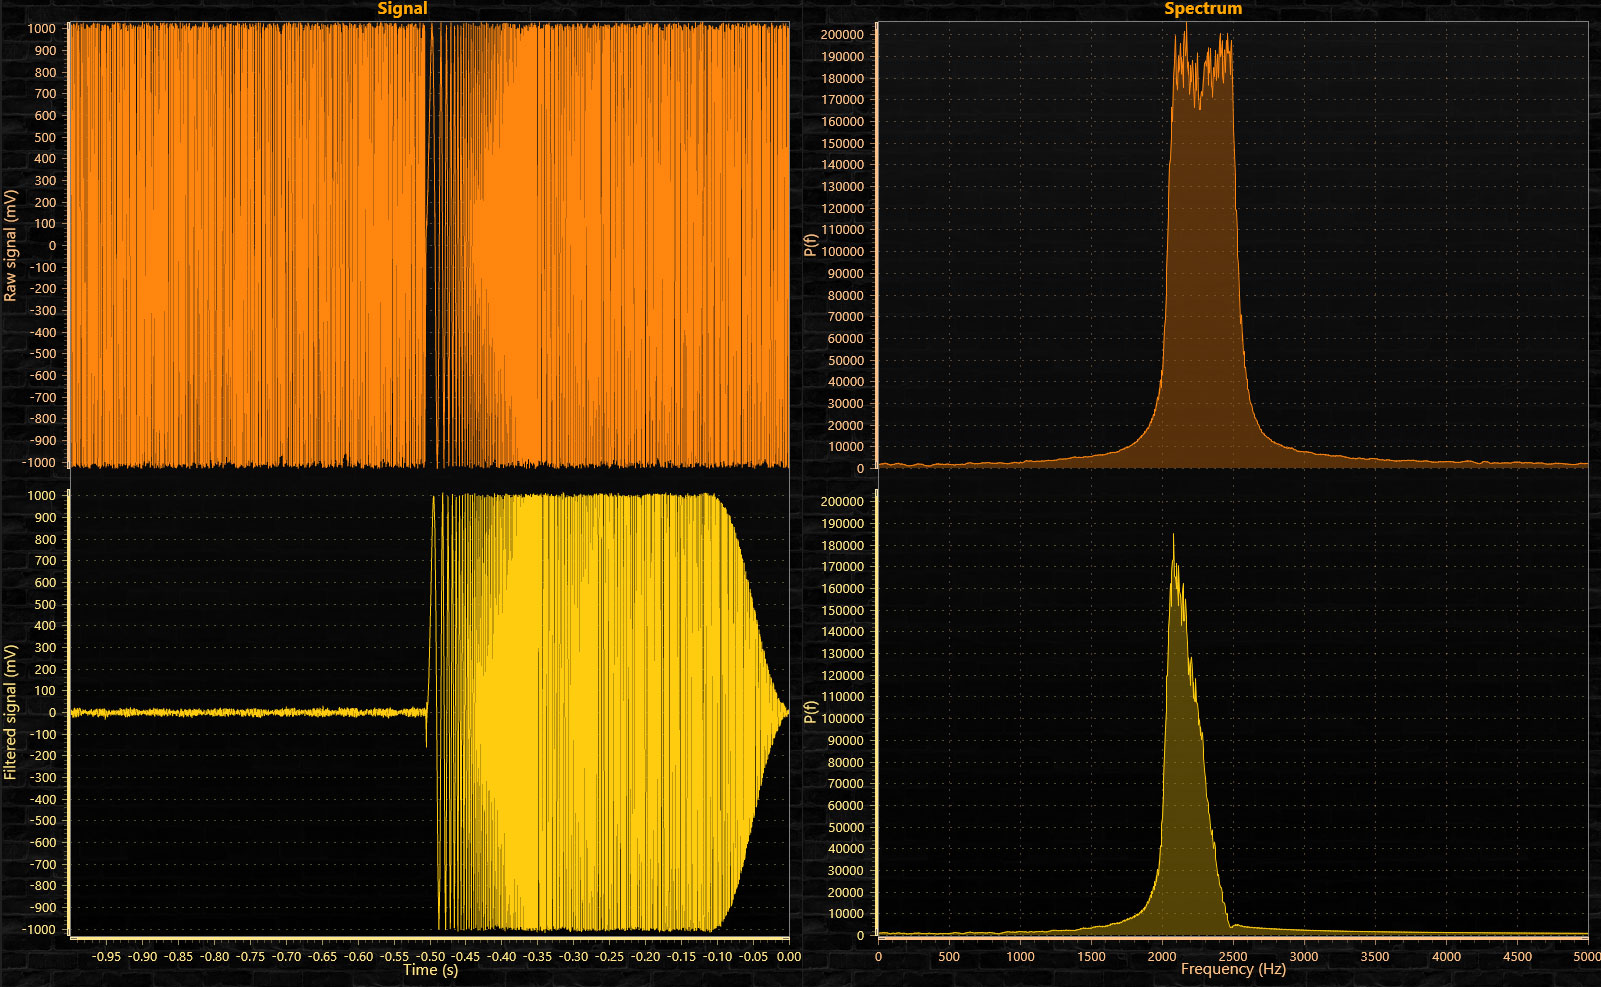
We need to disable the control repaints while we update the chart properties. In this case, we will create two chart objects (Signal and Spectrum). The first chart to be configured is the Signal chart and for this article, we will focus on filters, so the review of the chart properties will be simplified.
AxisX xAxis2 = new AxisX(_Chart.ViewXY);
xAxis2.Title.Text = "Time (s)";
xAxis2.PanningEnabled = false;
xAxis2.MajorGrid.Visible = false;
xAxis2.MinorGrid.Visible = false;
_Chart.ViewXY.XAxes.Add(xAxis2);

            _Chart.ViewXY.YAxes.Add(new AxisY());
            _Chart.ViewXY.XAxes[0].Title.Text = "time (s)";
            _Chart.ViewXY.YAxes[0].SetRange(-1200, 1200);
            _Chart.ViewXY.YAxes[0].Title.Text = "Raw signal (mV)";
            _Chart.ViewXY.YAxes[1].Title.Text = "Filtered signal (mV)";
            _Chart.ViewXY.YAxes[1].SetRange(-1200, 1200);
            _Chart.ViewXY.AxisLayout.YAxesLayout = YAxesLayout.Stacked;
            _Chart.ViewXY.AxisLayout.XAxisAutoPlacement = XAxisAutoPlacement.Off;
            _Chart.ViewXY.LegendBoxes[0].Visible = false;
            _Chart.Title.Text = "Signal";
            _Chart.ChartName = "Signal Filter";
            _Chart.ViewXY.DropOldSeriesData = true;
            _Chart.ViewXY.Zoomed += ViewXY_Zoomed;
As you can see, we have two Y-axes in the Y-Axis array. To configure a specific axis, we need to specify the index (starting with the zero index). We can assign the text or title of the axis, and set the range and other visual properties. The same process can be applied to the X-axis.
Creating the Area series to represent calculated FFT for a given signal.
AreaSeries UnfilteredAreaSeries = new AreaSeries(_ChartArea.ViewXY, _ChartArea.ViewXY.XAxes[0], _ChartArea.ViewXY.YAxes[0])
            {
                AllowUserInteraction = false
            };
            UnfilteredAreaSeries.LineStyle.Color = SDSRaw.Color;
            UnfilteredAreaSeries.LineStyle.Width = 1;
            UnfilteredAreaSeries.Fill.Color = ChartTools.CalcGradient(UnfilteredAreaSeries.LineStyle.Color, Colors.Black, 50);
            UnfilteredAreaSeries.Fill.GradientFill = GradientFill.Solid;
            UnfilteredAreaSeries.Title.Text = "P(f)";
            UnfilteredAreaSeries.LimitYToStackSegment = true;
            _ChartArea.ViewXY.AreaSeries.Add(UnfilteredAreaSeries);
Another Area series is created and assigned to the second Y-axis. This will correspond to the filtered properties.
AreaSeries FilteredAreaSeries = new AreaSeries(_ChartArea.ViewXY, _ChartArea.ViewXY.XAxes[0], _ChartArea.ViewXY.YAxes[1])
            {
                AllowUserInteraction = false
            };
            FilteredAreaSeries.LineStyle.Color = SDSFiltered.Color;
            FilteredAreaSeries.LineStyle.Width = 1;
            FilteredAreaSeries.Fill.Color = ChartTools.CalcGradient(UnfilteredAreaSeries.LineStyle.Color, Colors.Black, 50);
            FilteredAreaSeries.Fill.GradientFill = GradientFill.Solid;
            FilteredAreaSeries.Title.Text = "P(f)";
            FilteredAreaSeries.LimitYToStackSegment = true;
            _ChartArea.ViewXY.AreaSeries.Add(FilteredAreaSeries);
Adding a select list of signals:
SelectSignals.ItemsSource = new List<string>()
            {
                "Chirp (freq. sweep)",
                "1500Hz sine and 3500Hz sine",
                "Multiple square signals",
                "Multiple triangle signals",
                "Mixed sine, triangle, square"
            };
The behavior of those signals will be configured in another method.
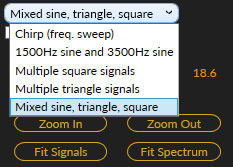
Selecting a signal type by default and enabling the control repaints:
SelectSignals.SelectedIndex = 0;
            _Chart.EndUpdate();
            _ChartArea.EndUpdate();
Filters
The sliders will update the values and behavior of the signals. You can see the slider objects located in the XAML layout:
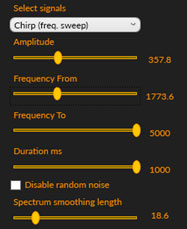
<Label Grid.Row="1" Content="Amplitude" Visibility="{Binding GenVisibility,ElementName=SignalFiltersIIRFIR}"/>
<Slider Style="{DynamicResource SliderStyle}" Grid.Row="2" Minimum="0" Maximum="1000" x:Name="Amplitude" ValueChanged="SliderValueChanged"  Visibility="{Binding GenVisibility,ElementName=SignalFiltersIIRFIR}"/>
<Label Grid.Row="2" Grid.Column="1" Content="{Binding Value, ElementName=Amplitude,Converter={StaticResource Rounder}}" HorizontalAlignment="Center" VerticalAlignment="Center"   Visibility="{Binding GenVisibility,ElementName=SignalFiltersIIRFIR}"/>
<Label Grid.Row="3" Content="Frequency From"  Visibility="{Binding GenVisibility,ElementName=SignalFiltersIIRFIR}"/>
<Slider Style="{DynamicResource SliderStyle}" Grid.Row="4" Minimum="0" Maximum="5000" x:Name="FrequencyFrom" ValueChanged="SliderValueChanged"  Visibility="{Binding GenVisibility,ElementName=SignalFiltersIIRFIR}"/>
<Label Grid.Row="4" Grid.Column="1" Content="{Binding Value, ElementName=FrequencyFrom,Converter={StaticResource Rounder}}" HorizontalAlignment="Center" VerticalAlignment="Center"  Visibility="{Binding GenVisibility,ElementName=SignalFiltersIIRFIR}"/>
<Label Grid.Row="5" Content="Frequency To"  Visibility="{Binding GenVisibility,ElementName=SignalFiltersIIRFIR}"/>
<Slider Style="{DynamicResource SliderStyle}" Grid.Row="6" Minimum="0" Maximum="5000" x:Name="FrequencyTo" ValueChanged="SliderValueChanged"  Visibility="{Binding GenVisibility,ElementName=SignalFiltersIIRFIR}"/>
<Label Grid.Row="6" Grid.Column="1" Content="{Binding Value, ElementName=FrequencyTo,Converter={StaticResource Rounder}}" HorizontalAlignment="Center" VerticalAlignment="Center"  Visibility="{Binding GenVisibility,ElementName=SignalFiltersIIRFIR}"/>
<Label Grid.Row="7" Content="Duration ms"  Visibility="{Binding GenVisibility,ElementName=SignalFiltersIIRFIR}"/>
<Slider Style="{DynamicResource SliderStyle}" Grid.Row="8" Minimum="1" Maximum="1000" x:Name="DurationMs" ValueChanged="SliderValueChanged"  Visibility="{Binding GenVisibility,ElementName=SignalFiltersIIRFIR}"/>
<Label Grid.Row="8" Grid.Column="1" Content="{Binding Value, ElementName=DurationMs, Converter={StaticResource Rounder}}" HorizontalAlignment="Center" VerticalAlignment="Center"  Visibility="{Binding GenVisibility,ElementName=SignalFiltersIIRFIR}"/>
When the value of any slider is changed, the method SliderValueChanged will be fired. You can see the reference to that method in the ValueChanged property of the Slider element.
The way to update the waveform frequency is pretty simple. Depending on the element name, the value of the related type of frequency will be updated. The value will be taken from the element (object).
private void SliderValueChanged(object sender, RoutedPropertyChangedEventArgs<double> e)
        {
            if(e.OldValue == e.NewValue || _SignalGenerator is null)
                return;

            Slider sli = sender as Slider;

            switch (sli.Name)
            {
                case "Amplitude":
                    _SignalGenerator.WaveformFrequencySweepSines[0].Amplitude = e.NewValue;
                    break;

                case "FrequencyFrom":
                    _SignalGenerator.WaveformFrequencySweepSines[0].FrequencyFrom = e.NewValue;
                    break;

                case "FrequencyTo":
                    _SignalGenerator.WaveformFrequencySweepSines[0].FrequencyTo = e.NewValue;
                    break;

                case "DurationMs":
                    _SignalGenerator.WaveformFrequencySweepSines[0].DurationMs = e.NewValue;
                    break;
                case "SelectSmooth":
                    _spectrumSmoothLength = (int)e.NewValue;
                    break;
}- FrequencySineSweepComponent
- Amplitude: Amplitude of sine sweep.
- Offset: Offset of the sine sweep.
- DurationMs: Duration of sine sweep in ms. Runs from starting frequency to end frequency during this duration.
- FrequencyFrom: Start frequency of sine sweep.
- FrequencyTo: End frequency of sine sweep.
- Enabled: the sweep component is included in the calculation of the output signal.
Signals Selection
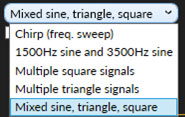
The way how the signals are selected is very similar to the sliders. There is a combo box element in the XAML that executes the SelectSignals_SelectionChanged method.
<StackPanel Grid.Row="0">
<Label Content="Select signals"></Label>
<ComboBox x:Name="SelectSignals" SelectedItem="0" SelectionChanged="SelectSignals_SelectionChanged" Template="{DynamicResource SelectSignalsCB}"></ComboBox>
</StackPanel>
The values in the combo box were created in the CreateChart method. Depending on the selected index, a waveform with its own properties will be displayed.
case 0:
                    _SignalGenerator.WaveformFrequencySweepSines.Add(new FrequencySineSweepComponent()
                    {
                        Amplitude = 1000,
                        DurationMs = 1000,
                        FrequencyFrom = 0,
                        FrequencyTo = 5000
                    });
                    Amplitude.Value = _SignalGenerator.WaveformFrequencySweepSines[0].Amplitude;
                    FrequencyFrom.Value = _SignalGenerator.WaveformFrequencySweepSines[0].FrequencyFrom;
                    FrequencyTo.Value = _SignalGenerator.WaveformFrequencySweepSines[0].FrequencyTo;
                    DurationMs.Value = _SignalGenerator.WaveformFrequencySweepSines[0].DurationMs;

                    Controls(true);
                    break;
                //Sines 2x
                case 1:
                    _SignalGenerator.WaveformSines.Add(new SineComponent()
                    {
                        Amplitude = 1000,
                        Frequency = 1500

                    });
                    _SignalGenerator.WaveformSines.Add(new SineComponent()
                    {
                        Amplitude = 1000,
                        Frequency = 3500
                    });

                    Controls(false);
                    break;
                //Squares 3x
As you can see, a new frequency component is created depending on the selected index. The first index will have the Amplitude, FrequencyFrom, FrequencyTo, and DurationMs filters. The rest of the index won’t have filters. For this example, random signals are created by each waveform.
- SignalGenerator:
SineComponent: Sine waveform.SquareComponent: Square waveform.TriangleComponent: Triangle waveform.AmplitudeSineSweepComponent: Sine amplitude sweep waveform component. Runs with constant frequency, from amplitude to another, during a given duration.
- FIR Filters:
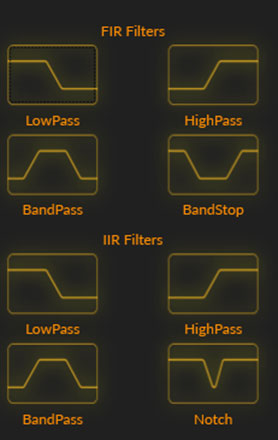
The FIR Filters are XAML button elements, that will execute the Button_Click method:
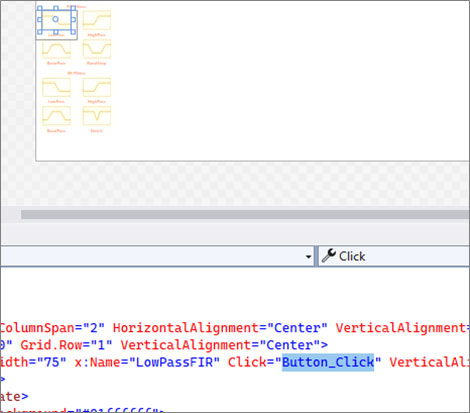
Depending on the name, a specific factors array will be assigned to the FIR or IIR selected Filter:
case "LowPassFIR":
                    _FIRFilter.SetFactors(_FirLowPass);
                    FirIsInUse = true;
                    break;

                case "HighPassFIR":
                    _FIRFilter.SetFactors(_FirHighPass);
                    FirIsInUse = true;
                    break;

                case "BandPassFIR":
                    _FIRFilter.SetFactors(_FirBandPass);
                    FirIsInUse = true;
                    break;

                case "BandStopFIR":
                    _FIRFilter.SetFactors(_FirBandStop);
                    FirIsInUse = true;
                    break;

                case "LowPassIIR":
                    _IIRFilter.SetABFactors(new double[] {
                        0.4040290988223374,-1.979297129242377,3.6857057965464457,-3.1010890119996937,1},
                        new double[] {1,4,6,4,1},
                        -10000000000, 10000000000, 1711.4579957006445);
                    FirIsInUse = false;
Zoom in/out – Fit waveforms
These controls are button elements located in the XAML:
<Button Style="{DynamicResource RoundedButton}" Grid.Row="3" Grid.Column="0" Margin="10,5" Content="Zoom In" Tag="In" Click="SignalZoom"/>
<Button Style="{DynamicResource RoundedButton}" Grid.Row="3" Grid.Column="1" Margin="10,5" Content="Zoom Out" Tag="Out" Click="SignalZoom"/>
<Button Style="{DynamicResource RoundedButton}" Grid.Row="5" Grid.Column="0" Margin="10,5" Content="Fit Signals" Tag="SignalsFit" Click="SignalZoom"/>
<Button Style="{DynamicResource RoundedButton}" Grid.Row="5" Grid.Column="1" Margin="10,5" Content="Fit Spectrum" Tag="SpectrumFit" Click="SignalZoom"/>SignalZoom method will be executed:private void SignalZoom(object sender, RoutedEventArgs e)
{
switch((sender as Button).Tag)
{
case "In":
if(_Chart.ViewXY.XAxes[0].Maximum > (_Chart.ViewXY.XAxes[0].Maximum - _Chart.ViewXY.XAxes[0].Minimum) / 2)
{
_Chart.ViewXY.XAxes[0].Minimum += (_Chart.ViewXY.XAxes[0].Maximum - _Chart.ViewXY.XAxes[0].Minimum)/2;
_Chart.ViewXY.XAxes[1].Minimum += (_Chart.ViewXY.XAxes[1].Maximum - _Chart.ViewXY.XAxes[1].Minimum)/2;
}
break;
case "Out":
_Chart.ViewXY.XAxes[0].Minimum -= (_Chart.ViewXY.XAxes[0].Maximum - _Chart.ViewXY.XAxes[0].Minimum)/2;
_Chart.ViewXY.XAxes[1].Minimum -= (_Chart.ViewXY.XAxes[1].Maximum - _Chart.ViewXY.XAxes[1].Minimum)/2;
break;
case "SignalsFit":
FitSignalsY();
break;
case "SpectrumFit":
FitSpectrumY();
break;
}
}The tag property will help to determine what action to take. For zoom-in, the minimum axis value will be increased by adding the result of the current maximum value minus the current minimum by 2; only if the maximum value is greater than the minimum.
To zoom out, we just need to increase the minimum axis value, no matter if this is greater than the maximum value. The Fit options will adjust the axes to the max value of the waveforms. For the FitSignalsY, it will set a default range value for both X and Y-axes.
private void FitSpectrumY()
        {
            _ZoomSpectrumthread = new Thread(ThreadedZoom);
            _ZoomSpectrumthread.IsBackground = true;
            _ZoomSpectrumthread.Start();
        }

        /// <summary>
        /// Thread to do zoom operation 1s cap
        /// </summary>
        private void ThreadedZoom()
        {
            _highestSpectrumSpike = 0;
            Thread.Sleep(1000);
            Dispatcher.Invoke(() =>
            {
                _ChartArea.BeginUpdate();
                _ChartArea.ViewXY.YAxes[0].SetRange(0, _highestSpectrumSpike);
                _ChartArea.ViewXY.XAxes[0].SetRange(0,5000);
                _ChartArea.EndUpdate();
            });
}FitSpectrumY: It will get the amplitude values and set those values as negative/positive ranges.
private double getAmplidutes()
        {
            double overal = 0;
            foreach (AmplitudeSineSweepComponent aswc in _SignalGenerator.WaveformAmplitudeSweepSines)
            {
                overal += aswc.AmplitudeTo - aswc.AmplitudeFrom;
            }
            foreach (FrequencySineSweepComponent fssc in _SignalGenerator.WaveformFrequencySweepSines)
            {
                overal += fssc.Amplitude;
            }
            foreach (SineComponent sc in _SignalGenerator.WaveformSines)
            {
                overal += sc.Amplitude;
            }
            foreach (SquareComponent sc in _SignalGenerator.WaveformSquares)
            {
                overal += sc.Amplitude;
            }
            foreach (TriangleComponent tc in _SignalGenerator.WaveformTriangles)
            {
                overal += tc.Amplitude;
            }
            foreach (RandomNoiseComponent rnc in _SignalGenerator.WaveformRandomNoises)
            {
                overal += rnc.Amplitude;
            }
            return overal;
        }
    }
Depending on the currently selected waveform type, the loop will return the amplitude values. The amplitude is a value that was stored in the waveform-type class, derived from the Signal Generator class when we first created our waveform object for the digital signal processing filters app project.
Final Application
This project is quite long but I think it’s an excellent example of how to implement interface controls, which can modify the structure of signals in a digital signal processing filters application. The Signal Generator class gives us many properties that help us obtain and modify the values and shapes of our waveforms.
I guess the real challenge is getting the values for the analog filters. I don’t have much knowledge on this topic but the LightningCharts interactive example is really helpful and makes it easier to understand the topic through programming logic.
If you haven’t tried the interactive examples yet, I highly recommend you download the Interactive Examples application. You can practice with this and the other charting app examples that LightningChart .NET has to offer.
Thank you very much for your visit!

