Telecommunication Charts
Unlock superior data visualization capabilities to develop powerful and efficient charting applications with LightningChart
Develop high-precision charting apps for the TelCo industry
LightningChart provides an extensive variety of charting components for building the most interactive and high-performance charting applications for the TelCo industry, including XY charts, LineSeries, MapCharts, LiDAR, and more.
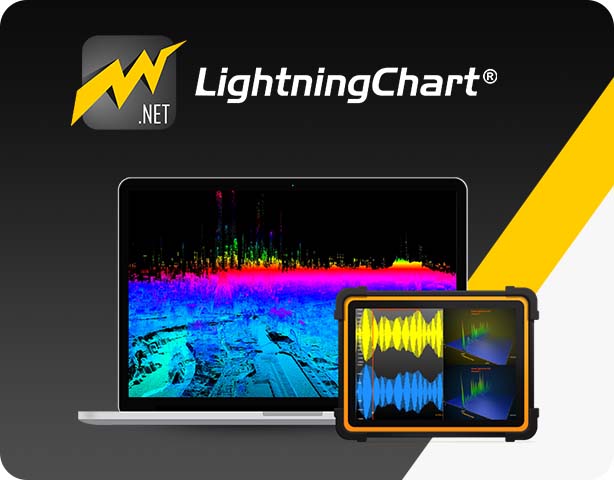
State-of-the-art controls for developing .NET charting applications
LightningChart .NET controls feature a wide range of customization capabilities for building unique charting applications. TelCo charts are pre-built components ready for integration and feature advanced XY, LineSeries, 2D & 3D series, as well as real-time controls.
LightningChart .NET controls feature a wide range of customization capabilities for building unique charting applications. TelCo charts are pre-built components ready for integration and feature advanced XY, LineSeries, 2D & 3D series, as well as real-time controls.
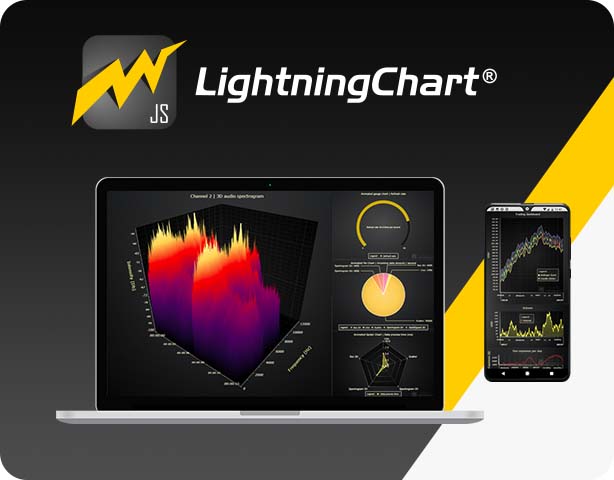
Build real-time TelCo cross-platform applications with LightningChart JS
LightningChart JS supports advanced real-time monitoring and streaming cross-platform applications for processing Telecommunications data at the best performance.
How can high-performance charting components benefit the Telecommunications industry?
The most powerful charting components enable real-time data visualization vital in the telecom industry for monitoring performance, supporting advanced analysis, and improving how end-users interact with charting applications.
LightningChart .NET and JS have been built to unlock what other libraries can’t do: real-time analysis of large and complex datasets at unbeatable performance, with easy-to-use APIs, and ready for integration within applications that require visualizing data.

You are in good company
Read how LightningChart has helped these companies develop their applications


Get started with LightningChart Telecommunication Charts
Start development with LightningChart

TutorialDataGrid Monitoring Application

TutorialWPF Polar Radar Chart
If you have any questions, feel free to contact us!