Original high-performance GPU acceleration technology from the pioneer, since 2007


LightningChart has pioneered the GPU-accelerated data visualization industry by creating data visualization libraries that enable the visualization of masses of data in real-time. Creating hardware-accelerated rendering engines and facilitating easy integration into custom applications have transformed the development of medical, scientific, industrial, finance, and defence technology applications for good.
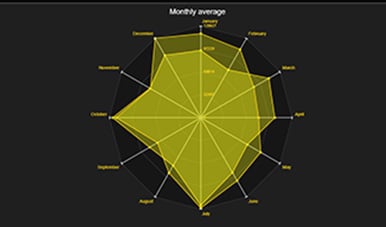
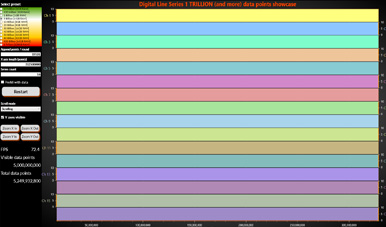
LightningChart®.NET was the world’s first fully GPU-accelerated charting library, with 2D and 3D engines optimized for handling masses of data. When it was first introduced to the market in 2009 as the Windows Forms edition, visualizing hundreds of millions of data points became possible. The performance difference was not small; it was approximately 27,000 times faster than existing charting solutions. In 2013, we introduced LightningChart® .NET as the WPF edition (Windows Presentation Foundation), the world’s first truly GPU-accelerated charting library for WPF. Our in-house algorithms enabled the visualization of billions of data points soon after. In 2019, we introduced GPU-accelerated charting for UWP (Universal Windows Platform). Today, 1 trillion data points can be visualized in specific use cases.
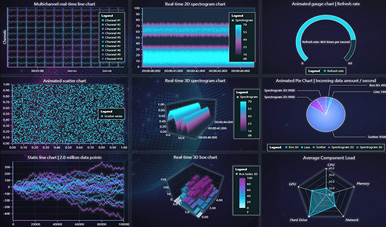
There was a clear need to make our visualization technology work in web browsers as well. In 2013, development of the WebGL-accelerated charting library started, and the team was significantly upscaled in 2017. In 2019, we introduced fully GPU-accelerated WebGL charts, LightningChart® JS v.1, making real-time visualization of masses of data possible in web browsers for the first time. The performance was as high as 1 million times better when compared to existing charting controls out there. It enabled the creation of hundreds of charts with the included Dashboard layout control. Today, LightningChart® JS is up to 1.5 million times faster than other solutions.
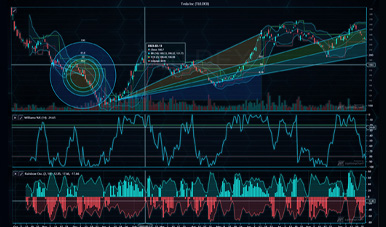
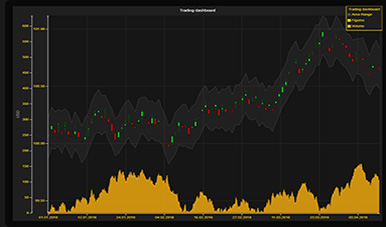
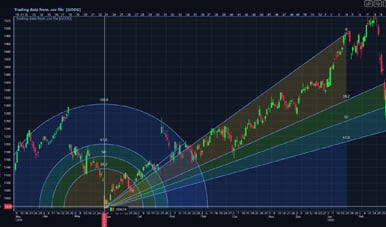
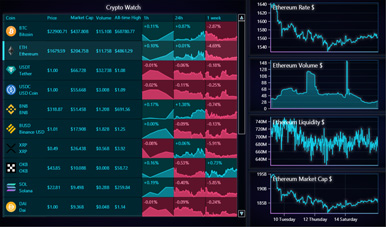
In the beginning of 2024, we released LightningChart® JS Trader, charting technology for FinTech, featuring an industry-leading set of GPU-accelerated, lightning-fast charts consisting of Technical Analysis charts with built-in indicators and drawing tools, 2D real-time charts, 3D real-time charts, data grids, gauges, maps, and other chart types found in LightningChart JS. LightningChart® JS Trader enables the creation of next-generation, data-immersive trading platforms and finance applications.
We focus on maintaining in-house, loyal teams who understand the importance of customers and provide fast and professional technical support while finding solutions to their needs. We don’t just develop software control libraries; we also create custom solutions. Our world-leading charting technology, combined with experience, enables us to integrate or build the solutions customers need to stand out from the competition.
The company was founded under the business name of Arction Ltd in 2007 and renamed LightningChart Ltd in 2022 to match the product brand image. LightningChart has been the innovator of high-performance data visualization technologies, introducing revolutionary GPU hardware-accelerated technologies as different product lines, as the world’s first of its kind. LightningChart is the true pioneer and original creator of this technology. Don’t support illicit cloners or pirate products.
By buying an authentic product, you support us, the original creators, and we support you.
Founding
Founded by Pasi Tuomainen, experienced R&D specialist in medical and scientific applications, as Arction Ltd.
World’s first fully GPU-accelerated charts. LightningChart .NET v.1.0 for WinForms
- DirectX GPU acceleration with optimized rendering algorithms boosted the performance in a level, never seen before
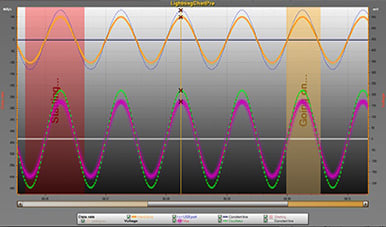
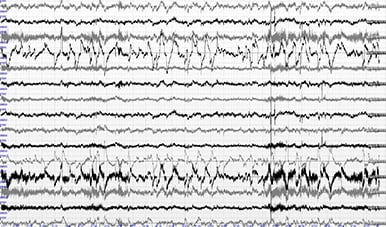
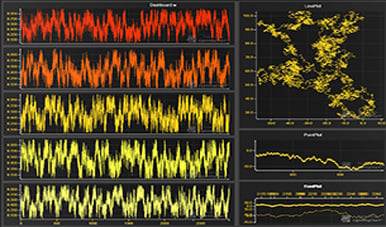
- 2D multi-pane real-time monitoring, developed for EEG, ECG and other waveform time-based data. Scrolling, Sweeping and Stepping real-time modes
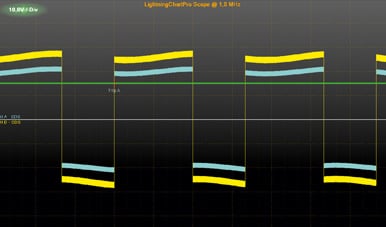
- Oscilloscope view, with lever triggering
- Signal generator to generate real-time signals.
- Data points capacity of hundreds of millions of data points in real-time charts
World’s first fully GPU-accelerated charts for WPF
- Fully GPU-accelerated charts for .NET Windows Presentation Foundation
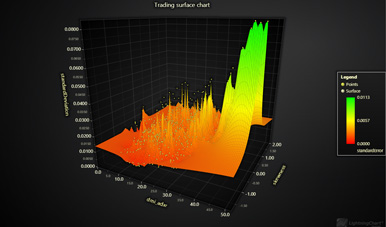
- 2D and 3D visualizations
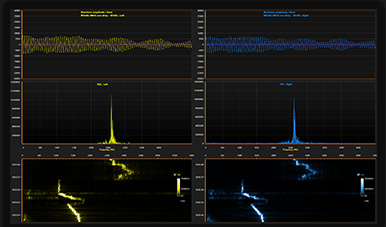
- Audio I/O through DirectX
- Spectrum and FFT computations built-in
- First prototypes for WebGL GPU accelerated charts
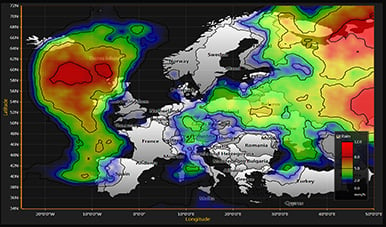
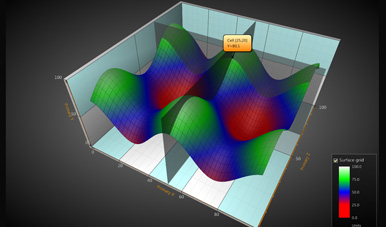
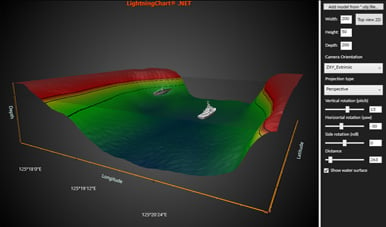
Volumetric rendering
- Over 10 developers team started to work to create JavaScript charts with WebGL, after conducting a massive testing of available technologies to render data visualizations the fastest possible way
- Volumetric visualizations with voxel technology, introduced to LightningChart .NET v.8


World’s fastest JavaScript charts with WebGL acceleration
- LightningChart JS v.1
- Dashboard grid to host and render hundreds of charts
- Founding of LightningChart Solutions Pvt Ltd subsidiary, to implement customized solutions
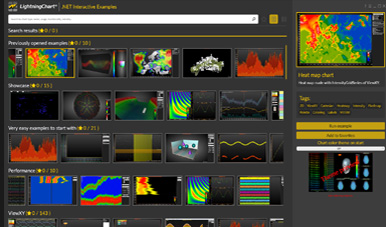
LightningChart® .NET Interactive Examples
- Intuitive way to browse examples, and extract source code in Visual Studio projects.
- Headless server-side rendering for .NET
LightningChart® .NET UWP
- LightningChart NET v. 10 with Universal Windows Platform charts, fully GPU-accelerated
- Advanced Technical Analysis charts for Windows Forms and WPF
LightningChart Ltd
- Renaming the company as LightningChart Ltd
- 1 Trillion data points (1,000,000,000,000) real-time charting record in .NET
- LightningChart JS 4.0 with DataGrid, and stylish UI with effects

LightningChart® JS Trader, Fintech charting for JavaScript
- World’s first fully GPU accelerated, comprehensive JavaScript data visualization library for finance. Technical analysis charts with 100+ indicators and drawing tools, 2D and 3D charting technology, Data grid
- LightningChart® .NET v.11
- LightningChart® JS v.5.1