LightningChart JSJavaScript Radar Chart
TutorialLearn how to create a JavaScript Radar chart and Spider chart with LightningChart JS
JavaScript Spider Chart
Data analysis has become an integral part of decision-making processes in various industries, from finance to healthcare to marketing. The amount of data being collected is increasing. This leads to a greater need for tools that can analyze and communicate complex data sets effectively. This is where data visualization comes in.
One popular type of data visualization is the Spider Chart, also known as a radar chart, polar chart, or star chart. Spider Charts are a type of chart that display data in a two-dimensional chart. All axes originate from the same point. They are particularly useful for displaying multivariate data and identifying patterns and trends.
Spider charts are a popular type of chart used to compare multiple products or variables across different dimensions. Industries such as food and sports often use spider charts to evaluate a product or an athlete’s performance.
This is important because performance needs to be assessed from multiple perspectives. For instance, spider charts can be an excellent way to display nutrient values for a particular food product.
Spider charts are similar to other types of charts. They plot data on two axes, usually from zero to the highest value. However, what sets spider charts apart is their unique plotting and coordination system.
While traditional charts rely on a Cartesian coordinate system with X and Y axes, spider charts use a polar coordinate system. In a polar coordinate system, the length from the center to the maximum value represents the data being plotted. This distinct approach to charting makes spider charts a valuable tool for analyzing and presenting multivariate data.
This article will explore how to create a Spider Chart using the LightningChart JS library. LightningChart JS is a powerful tool for creating advanced data visualizations in JavaScript.
We’ll cover the basics of Spider Charts and how to use them to effectively display multivariate data. Additionally, we’ll provide step-by-step instructions on how to create a Spider Chart with LightningChart.
We will focus on some of its key features. These features can help you improve your data visualization. Take your charting applications to the next level!
This article provides valuable insights and actionable tips on how to create impactful Spider Charts with the LightningChart library. It is applicable to both seasoned developers and those just starting with data visualization.
Creating a JavaScript spider chart
If you’re looking to create spider charts in JavaScript, the LightningChart library is an excellent choice. With its advanced data visualization capabilities, LightningChart makes it easy to create and customize spider charts to meet your specific needs.
There are two ways to create spider charts with LightningChart. The first is to use the LightningChart interface. The interface provides a range of options for customizing the appearance and functionality of your chart.
Secondly, LightningChart provides a way to create a spider chart. This is done by using a Dashboard. The Dashboard offers an easy-to-use interface that lets you create complex visualizations quickly and easily.
Both options provide a powerful and flexible way to create spider charts with LightningChart. LightningChart makes creating spider charts easy. The interface offers detailed control, while the Dashboard simplifies the process. These charts highlight your data in an attractive and meaningful way.
Spider charts are made in a very simple way:
// Create a spider chart and Three series.

const chart = lightningChart().Spider({

  theme: Themes.lightNew,

})
A spider chart can have many numbers of SpiderSeries added to it using SpiderChart.addSeries. Following is the example of adding a new SpiderSeries to the SpiderChart. Also provides an ability to specify styles for markers as well as lines individually.
const spiderSeries = chart.addSeries(PointShape.Circle)

   .setName('Positive feedback distribution')

   .setFillStyle(fillStyle)

   .setPointFillStyle(pointFillStyle)

   // etc ...
Adding data to the chart
Adding points with unique tags will automatically create new categorical axes for the Spider Chart. In the order of adding (the first axis will always point directly up, and the following ones will traverse clockwise). Adding more points to the same category tag in one series will override any previous values.
spiderSeries.addPoints(

   // Any number of { axis, value } pairs can be passed.

   { axis: 'Pre-planning', value: 6 },

   { axis: 'Customer contacts', value: 22 },

   { axis: 'Meetings', value: 61 },

   { axis: 'Development tIme', value: 76 },

   { axis: 'Releases', value: 100 }

)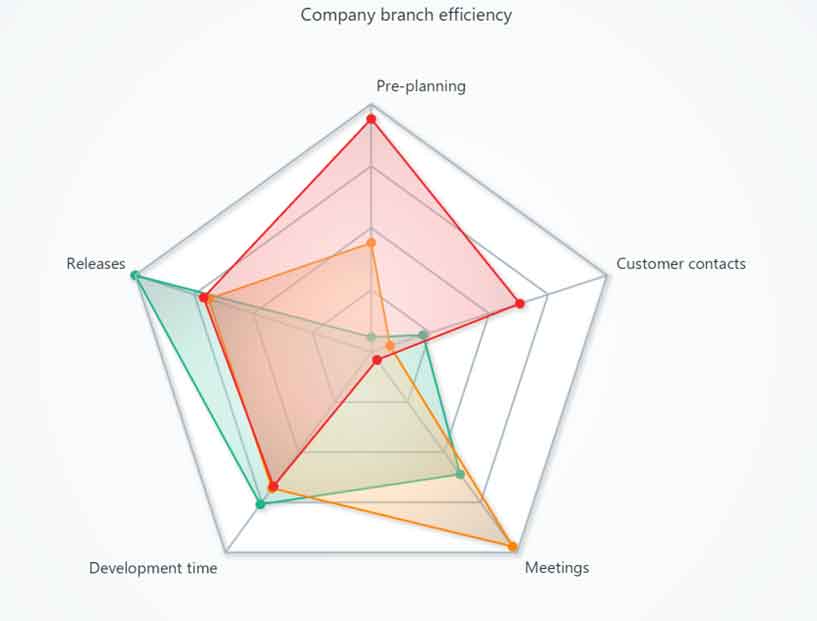
So, as you can see how easily we can create a spider chart with the help of LightingChart. A JavaScript radar chart creation is quite similar to a spider chart creation.
Setting styles
Creating a map chart with LCJS is extremely easy with the help of a type argument.
const MapChart= lightningChart().Map({
  type: MapTypes.World, // <-- Select MapType here
});
1. SpiderWebModes
SpiderCharts can be styled to look like traditional JavaScript radar charts by the usage of SpiderWebModes – more specifically, SpiderWebMode.Circle. It can be used for selecting the shape of the SpiderChart web like a circle or normal.
// Set the web mode of SpiderChart, affecting the shape of its background, webs, and nibs.
spiderChart.setWebMode(SpiderWebMode.Circle)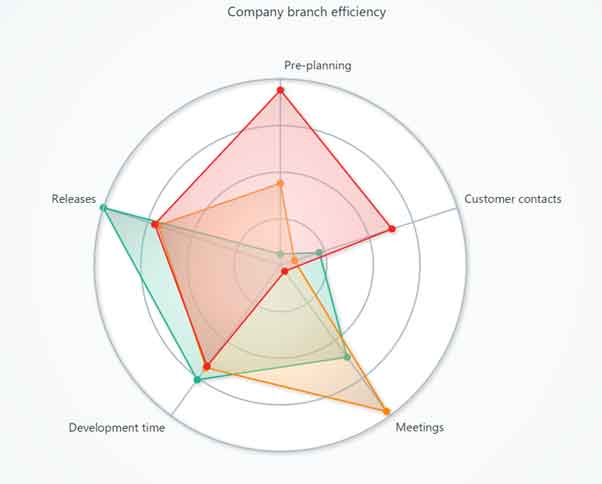
2. setWebStyle
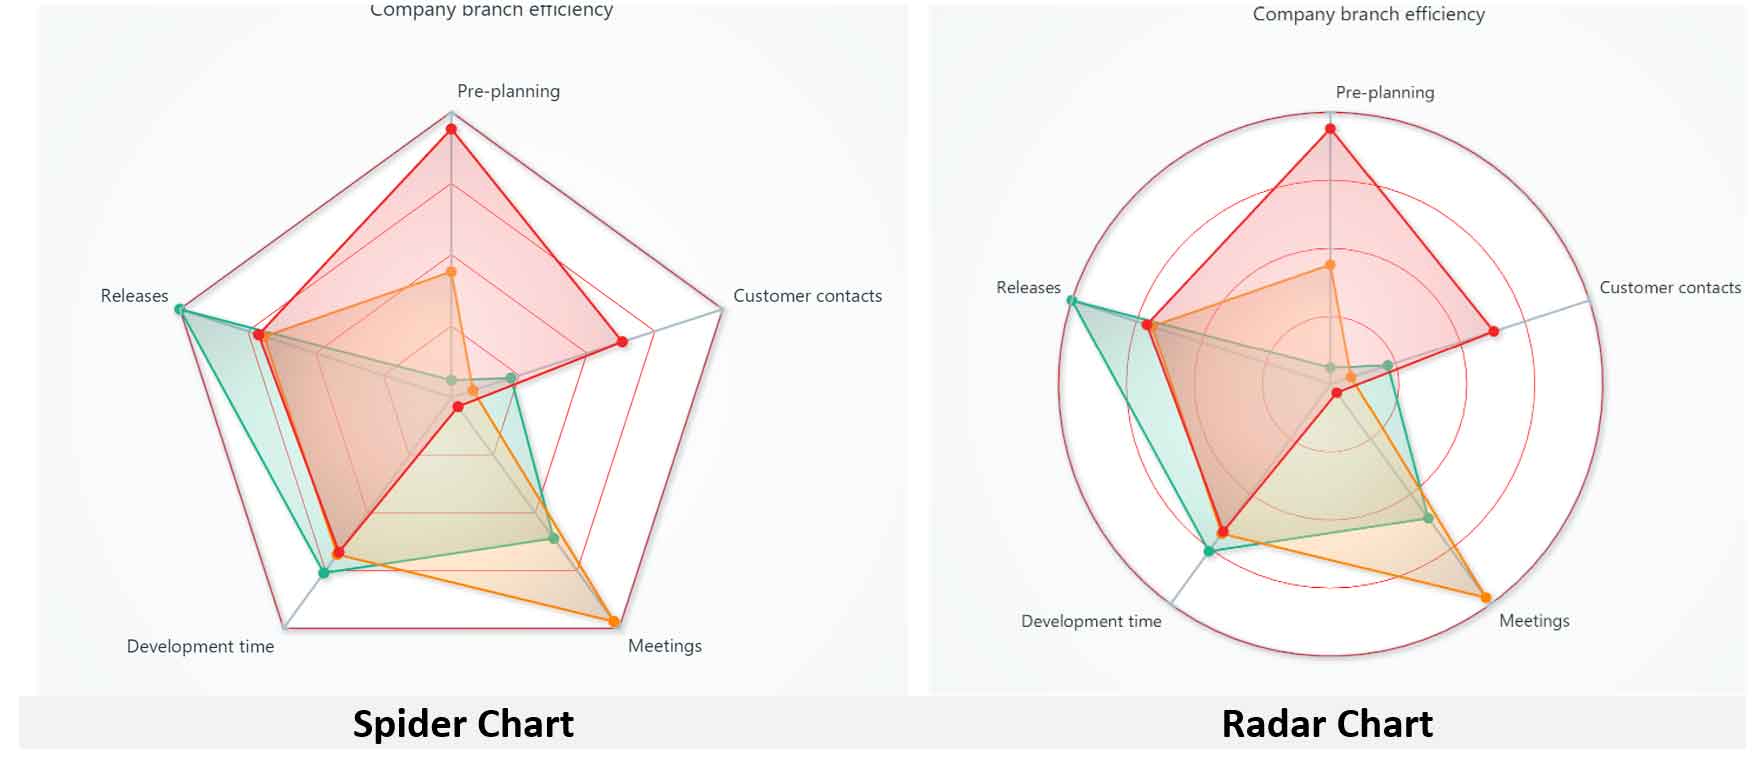
A JavaScript radar chart webs may be styled by using LineStyle. For that, we can use setWebStyle API which can be used as follows:
 spiderChart.setWebStyle(new SolidLine({

   thickness: 1,

   fillStyle: new SolidFill({ color: ColorRGBA( 255, 0, 0 ) })

 }))
3. setWebCount
By using setWebCount API we can set the count of ‘webs’ displayed on the JavaScript radar chart:
spiderChart.setWebCount(10)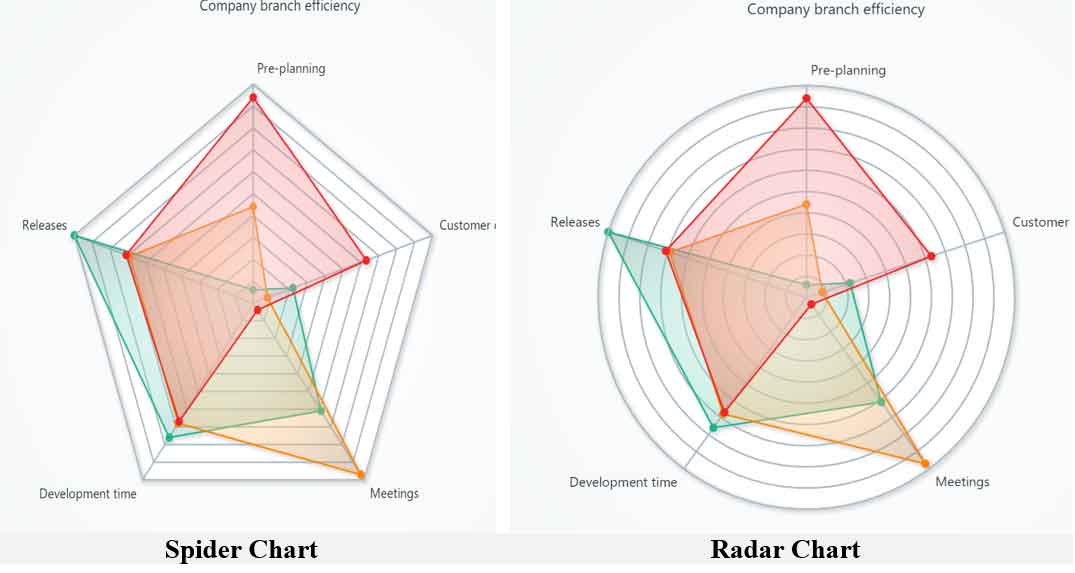
4. setNibLength
By using setNibLength API we can set the length of axis nibs in pixels for the JavaScript radar chart.
spiderChart.setNibLength(50)spiderChart.setNibLength(50)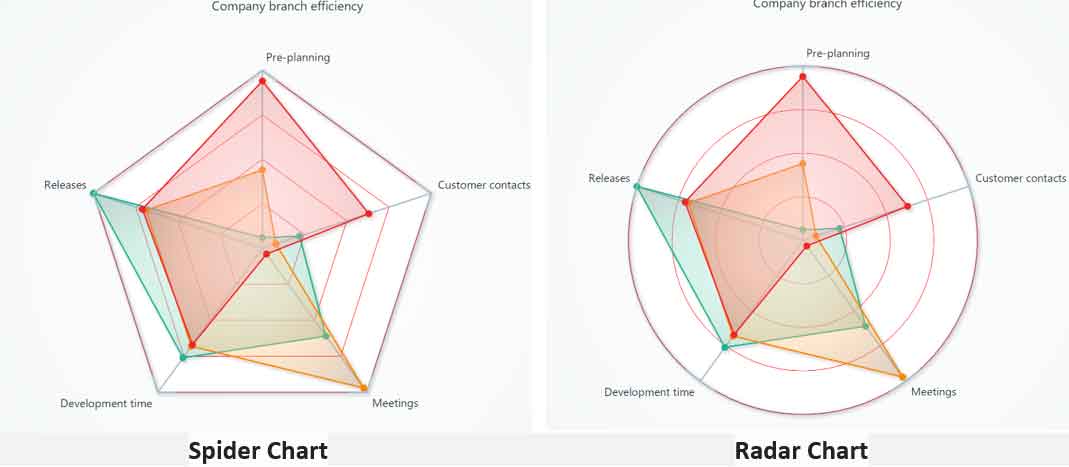
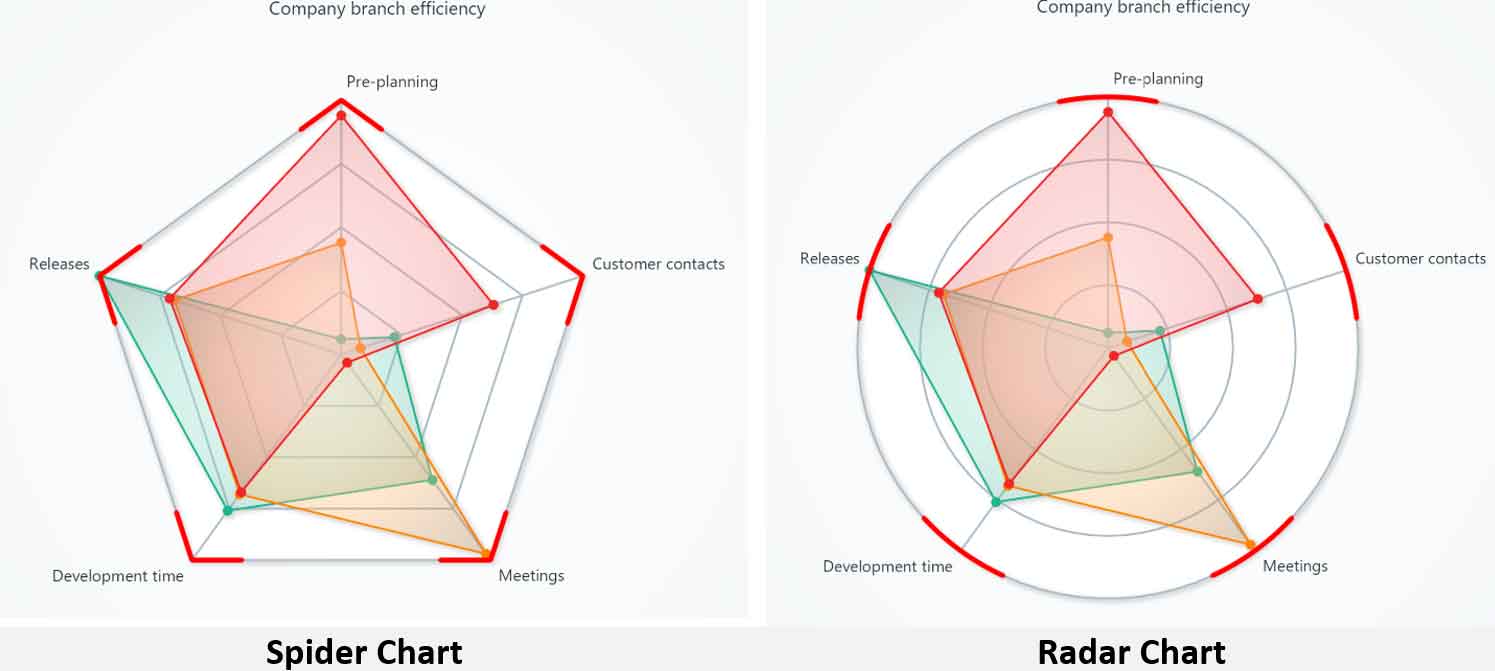
5. setNibStyle
By using setNibStyle API we can set the style of axis nibs as SolidLine for the JavaScript spider radar chart.
SpiderChart.setNibStyle(new SolidLine({

   thickness: 5,

   fillStyle: new SolidFill({ color: ColorRGBA( 255, 0, 0 ) })

 }))
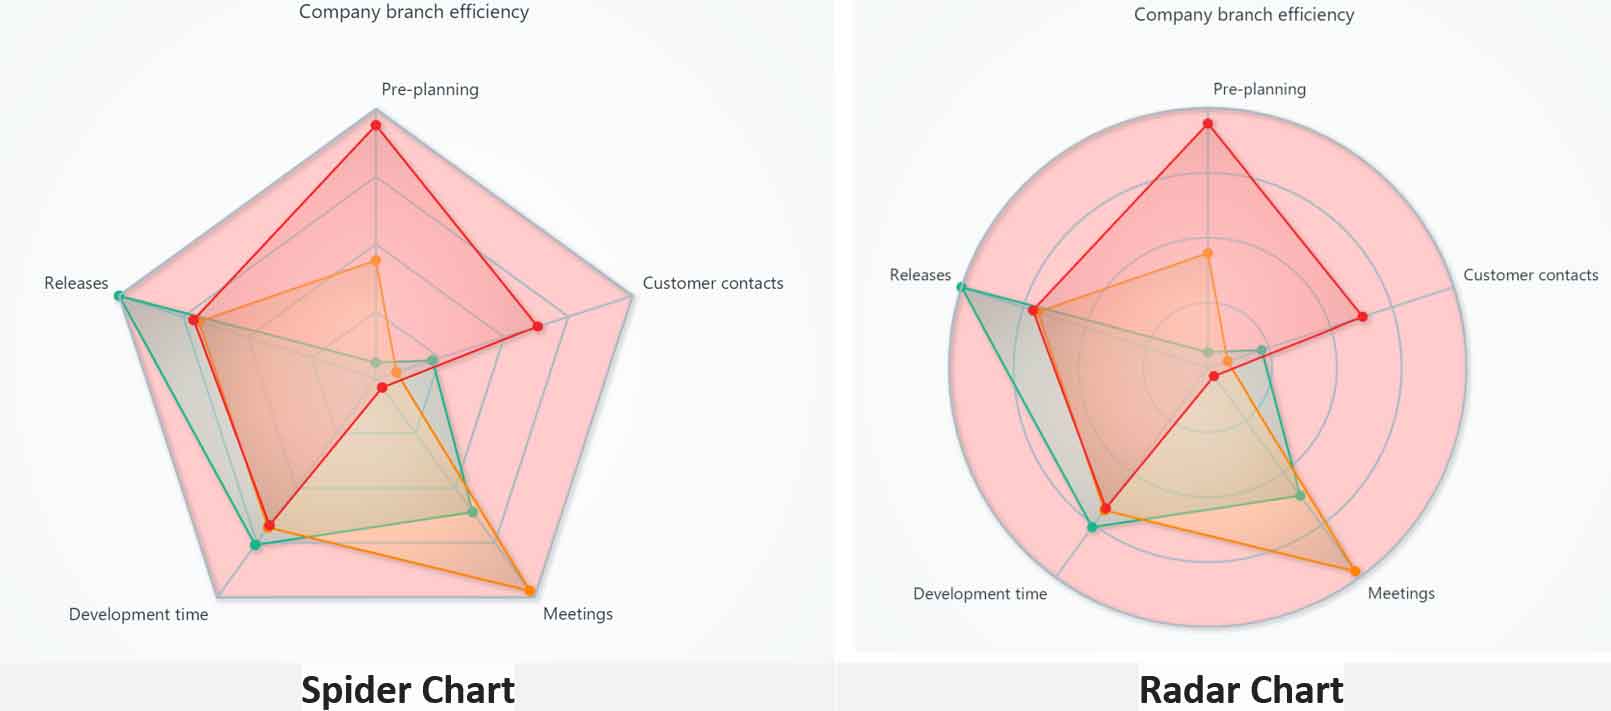
By using setSeriesBackgroundFillStyle API we can set FillStyle to series background(area behind series).
Conclusion
In summary, the LightningChart library offers an easy way to create a JavaScript radar chart or a spider chart variation. This allows you to show multivariate data in multiple dimensions.
Spider charts use intuitive visual elements to present data in a succinct way. This makes it easier to spot trends and patterns. It can help you gain insights more quickly.
Spider charts are a powerful tool that can help you make better decisions and achieve better outcomes. This applies to many different professions, such as data analysts, product managers, and sports coaches.
LightningChart makes adding and reading data to a spider chart very easy. This makes it an ideal tool for data analysts and visualization experts.
Spider charts are highly customizable. You can adjust the web count and scale to show the details in your data. This helps to make your data more visible.
Spider charts are a powerful way to visualize data. They are both informative and easy to understand. The LightningChart library makes it simple to create and customize spider charts. It meets your specific needs.
We hope this article has provided you with valuable insights into spider charts. We hope it has inspired you to explore their possibilities further.


