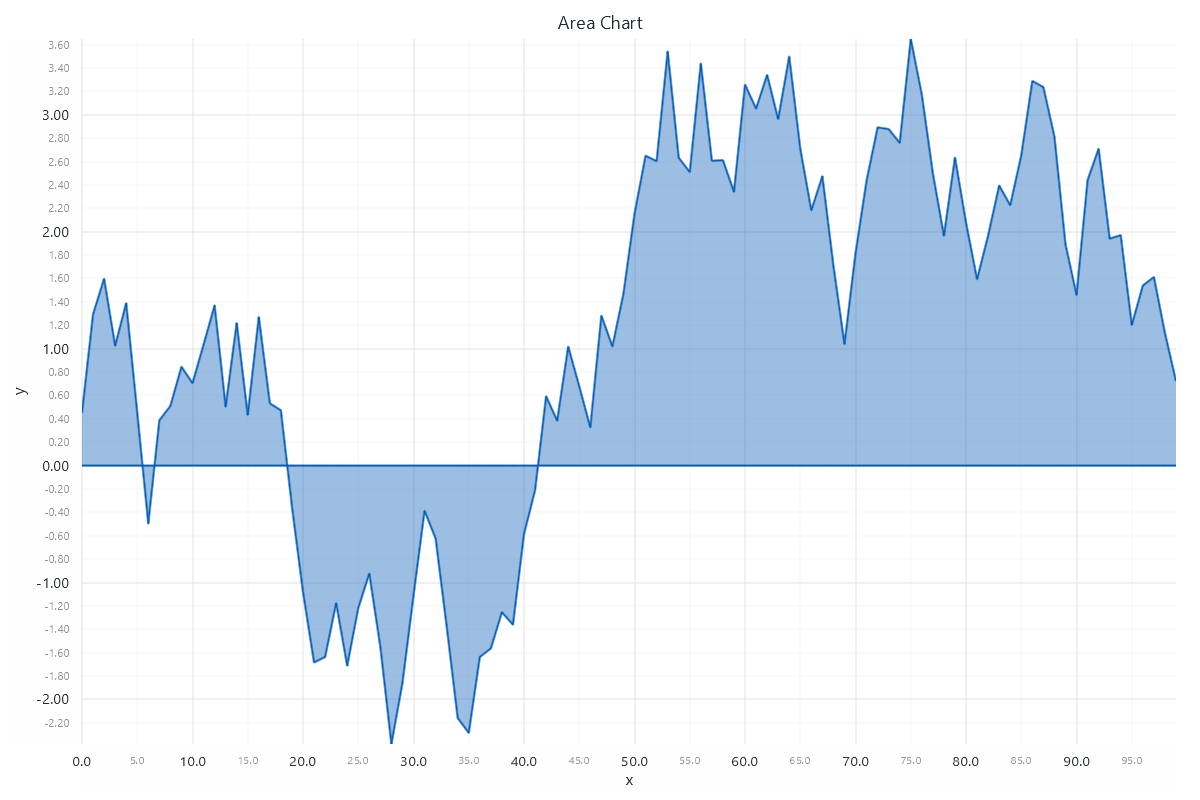
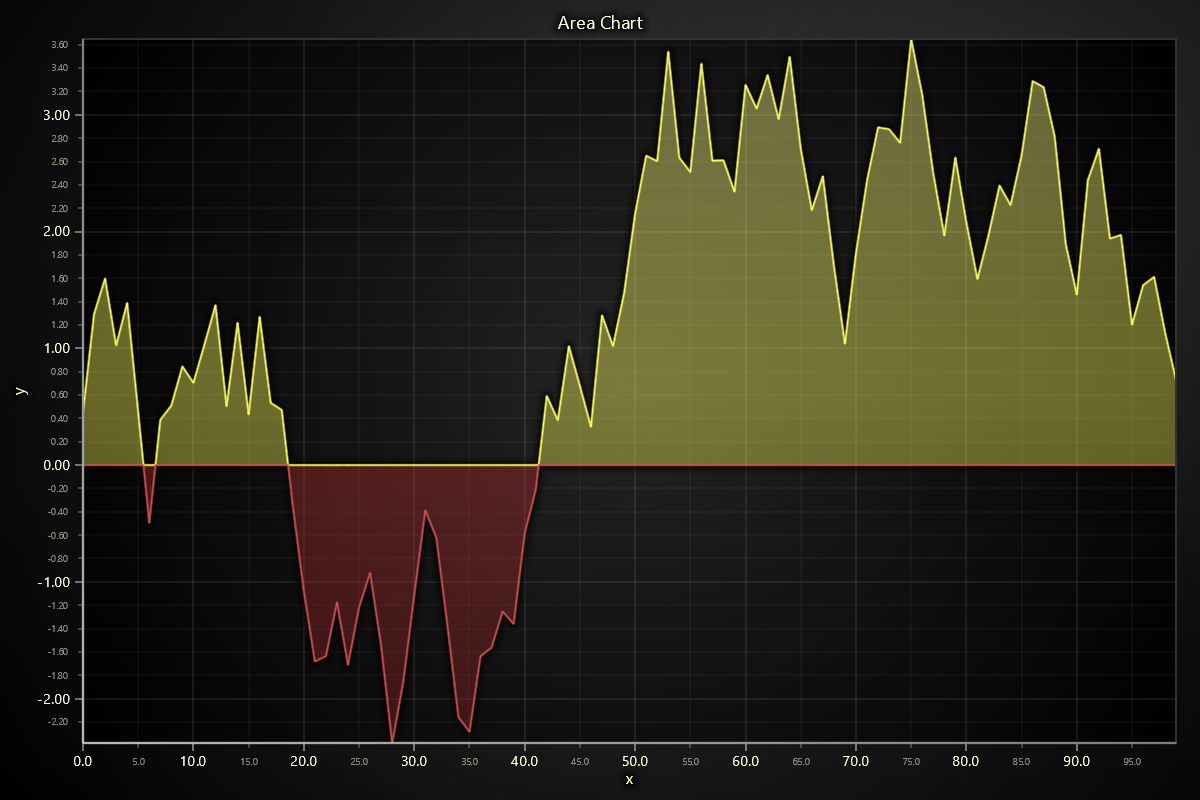
Area Chart
This chart type is used for visualizing area between a static base line and supplied curve data.
import lightningchart as lc
import random

lc.set_license('my-license-key')

x_values = list(range(0, 100))
y_values = []

y = 0
for i in range(100):
    y += (random.random() * 2) - 1
    y_values.append(y)

chart = lc.AreaChart(
    x=x_values,
    y=y_values,
    area_type='bipolar',
    theme=lc.Themes.White,
    title='Area Chart',
    xlabel='x',
    ylabel='y'
)
chart.open()