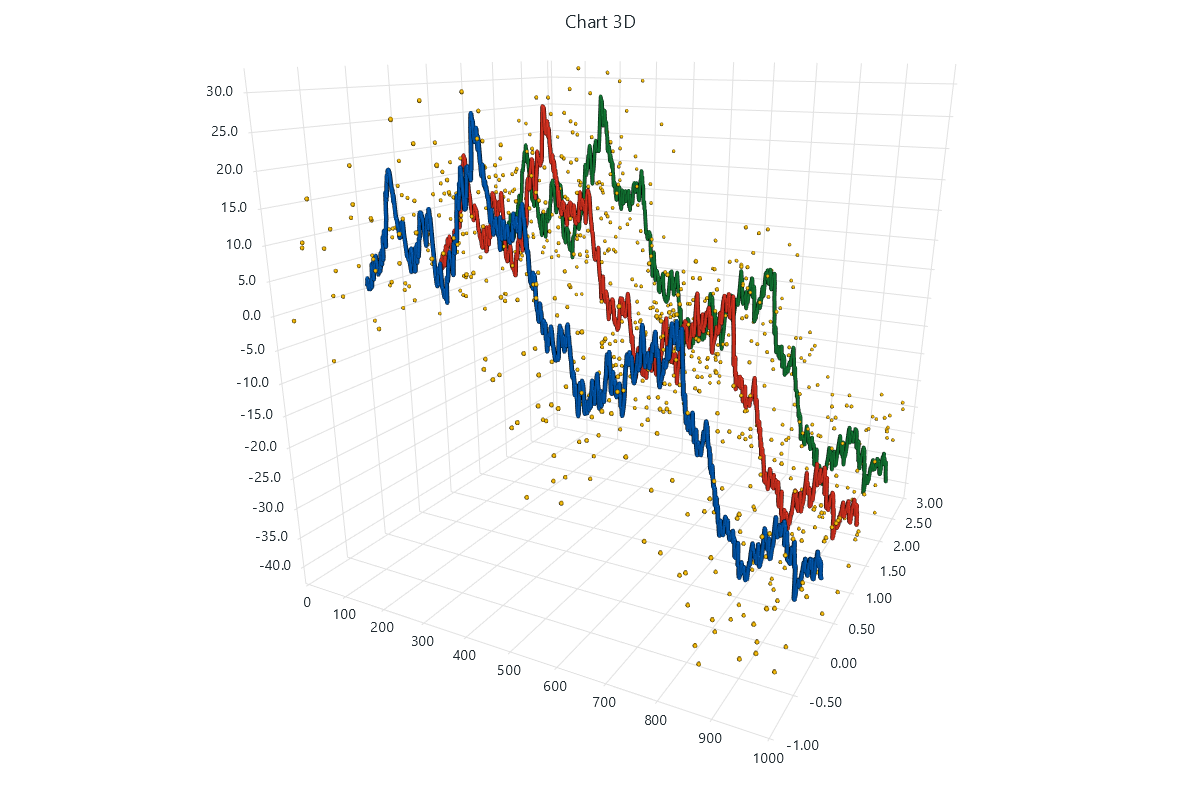
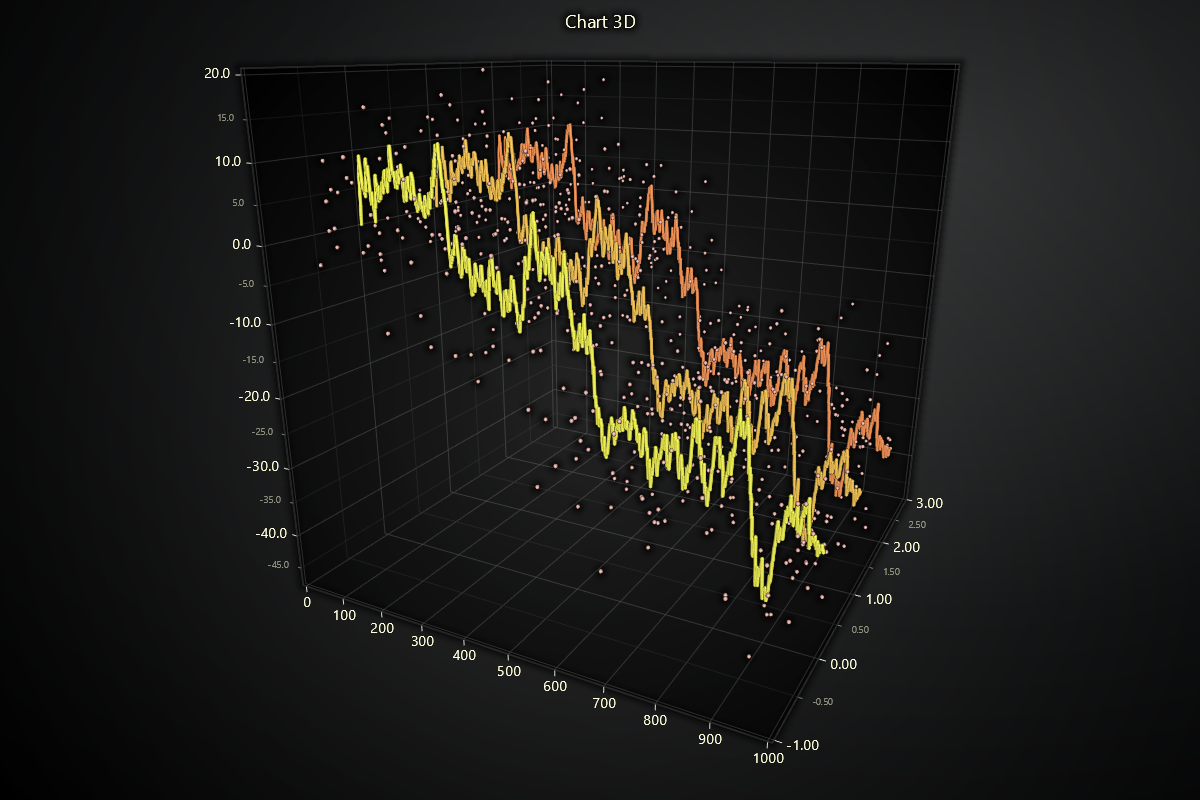
3D Chart
Chart for visualizing data in a 3-dimensional scene, with camera and light source(s).
Camera can be moved around with user interactions (mouse & touch). It is always oriented to face the center of the scene.
Light source is always located at the location of the Camera, and directed towards the center of Axes.
Data can be added to the Chart via various Series types, each with their own method of visualization.
import lightningchart as lc
import random

lc.set_license('my-license-key')

line_series_amount = 3
chart = lc.Chart3D(
    theme=lc.Themes.White,
    title='Chart 3D',
)

series = []
for i in range(line_series_amount):
    series.append(chart.add_line_series())
point_series = chart.add_point_series()
point_series.set_point_size(5)

y = 0
for x in range(1000):
    for i in range(line_series_amount):
        y = y + (random.random() * 2) - 1
        new_data = {'x': x, 'y': y, 'z': i}
        series[i].add_dict_data(new_data)
        if random.random() > 0.75:
            point_series.add(x=x, y=y + random.uniform(-10, 10), z=i + random.uniform(-1, 1))

chart.open()
Series types
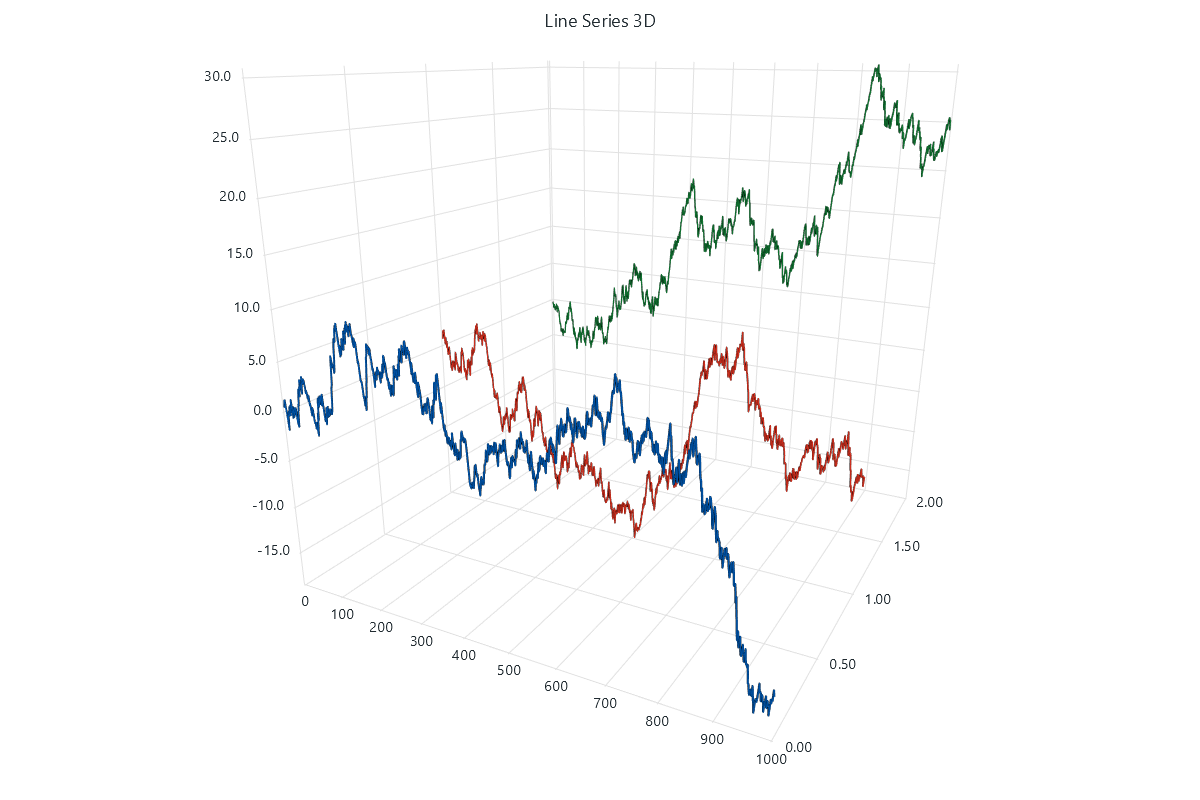
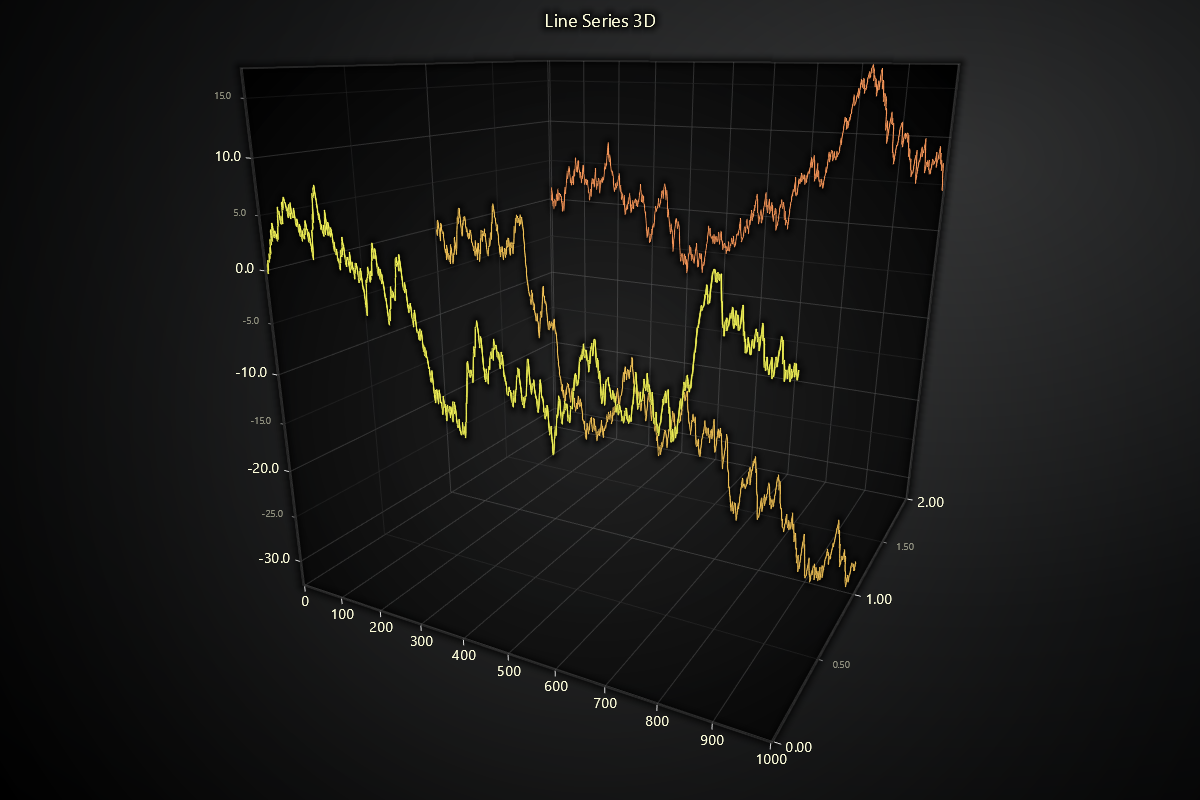
Line Series
import lightningchart as lc
import random

lc.set_license('my-license-key')

chart = lc.Chart3D(
    theme=lc.Themes.White,
    title='Line Series 3D'
)

series_amount = 3
series_list = []
for z in range(series_amount):
    series = chart.add_line_series()
    series.set_line_thickness(2)
    series_list.append(series)

data = []
for z in range(series_amount):
    data.append([])
    y = 0
    for x in range(1000):
        y += (random.random() * 2) - 1
        data[z].append({'x': x, 'y': y, 'z': z})

for i in range(len(series_list)):
    series_list[i].add(data[i])

chart.open()
Point Series
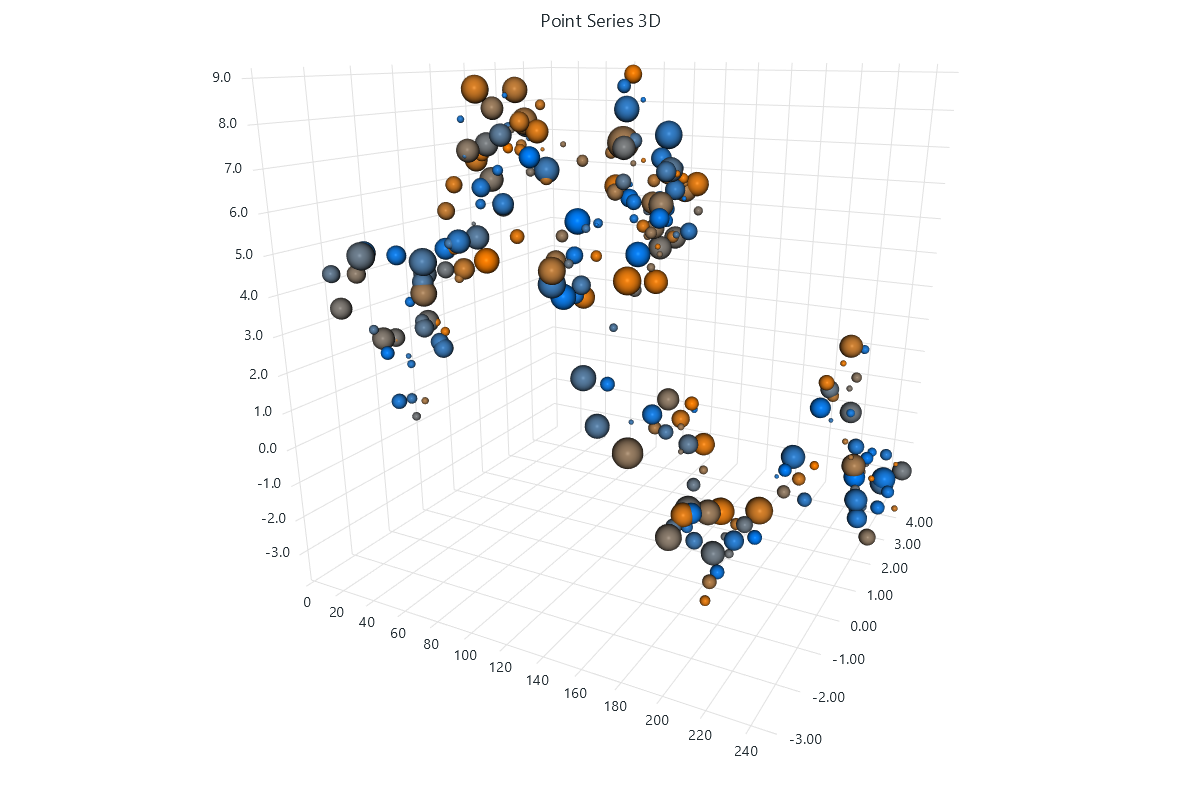
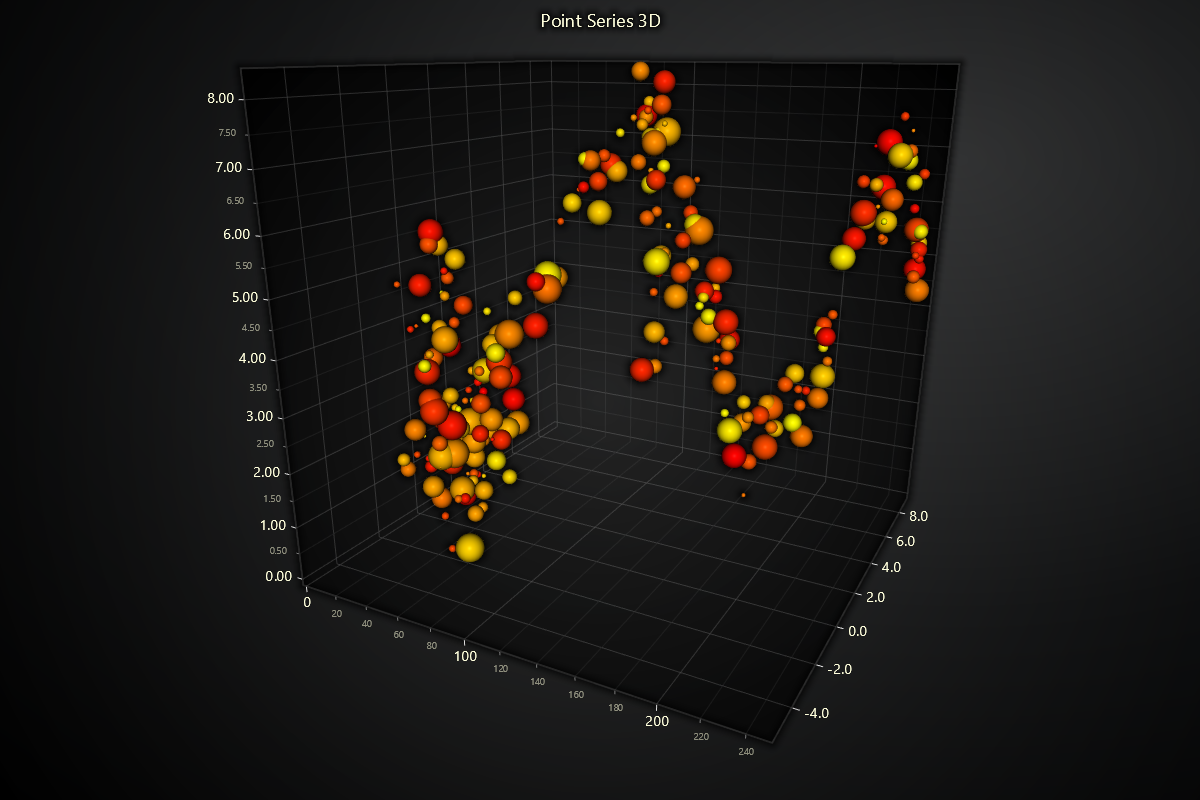
import lightningchart as lc
import random

lc.set_license('my-license-key')

chart = lc.Chart3D(
    theme=lc.Themes.White,
    title='Point Series 3D'
)

series = chart.add_point_series(
    render_2d=False,
    individual_lookup_values_enabled=True,
    individual_point_color_enabled=True,
    individual_point_size_axis_enabled=True,
    individual_point_size_enabled=True,
)
series.set_point_shape('sphere')
series.set_palette_point_colors(
    steps=[
        {'value': 0.0, 'color': lc.Color(255, 128, 0)},
        {'value': 1.0, 'color': lc.Color(0, 128, 255)},
    ],
    look_up_property='value',
    interpolate=True,
    percentage_values=True
)

data = []
y, z = 0, 0
for x in range(250):
    y += (random.random() * 2) - 1
    z += (random.random() * 2) - 1
    data.append({
        'x': x,
        'y': y,
        'z': z,
        'size': random.uniform(4, 32),
        'value': random.random()
    })
series.add(data)

chart.open()
Point Line Series
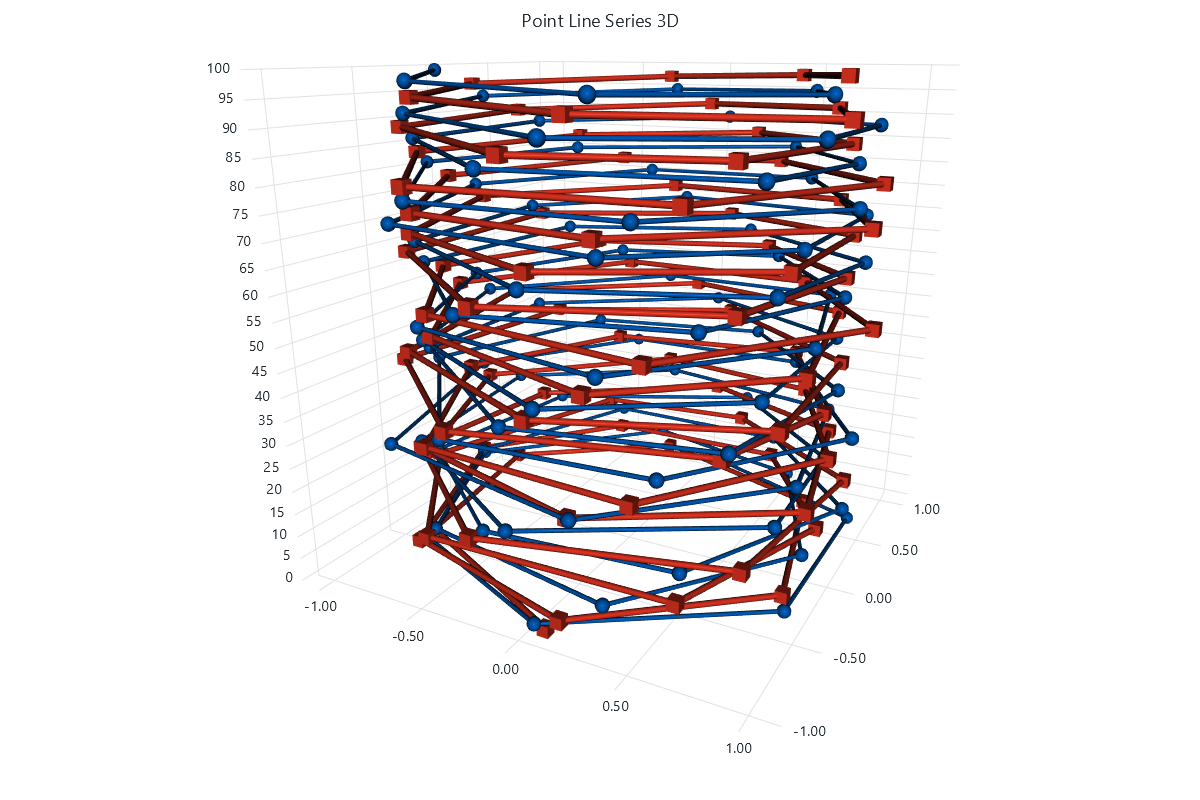
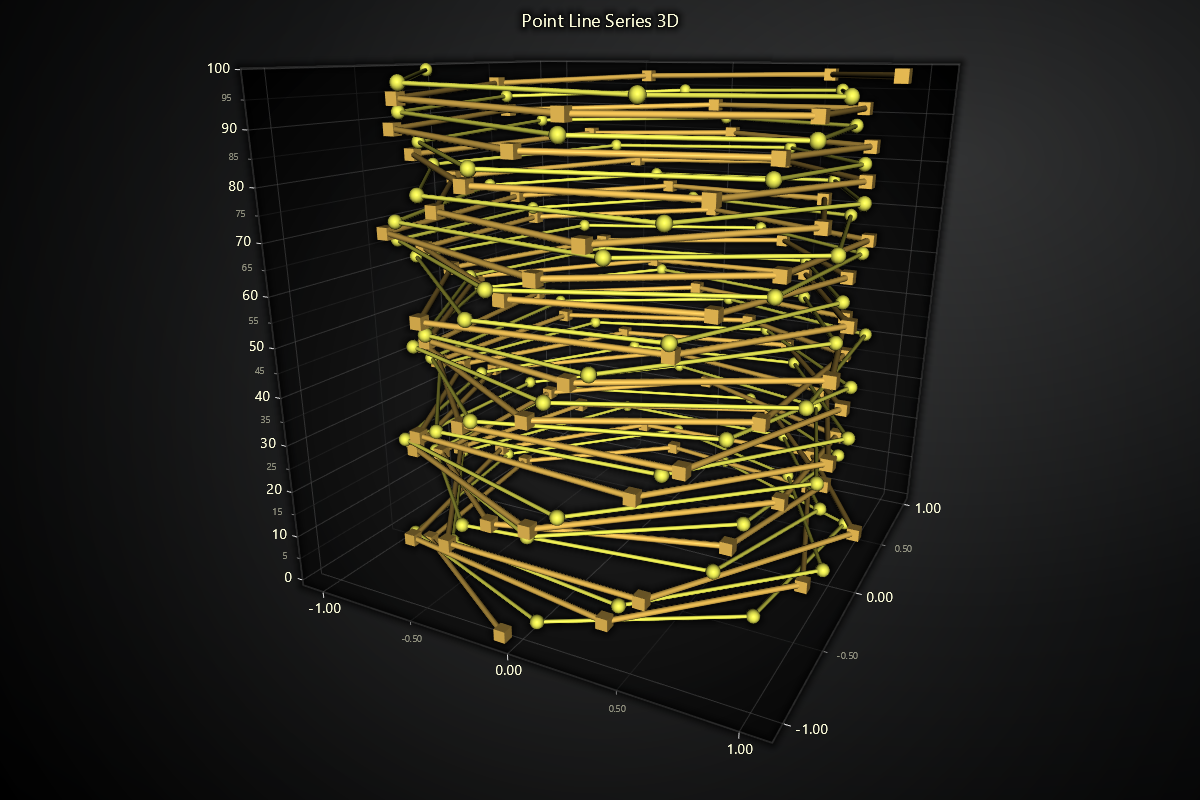
import lightningchart as lc
import math
import random

lc.set_license('my-license-key')

chart = lc.Chart3D(
    theme=lc.Themes.White,
    title='Point Line Series 3D'
)

series_sphere = chart.add_point_line_series().set_point_shape('sphere')
series_cube = chart.add_point_line_series().set_point_shape('cube')

series_sphere.set_line_thickness(5).set_point_size(16)
series_cube.set_line_thickness(7).set_point_size(14)

for y in range(0, 100):
    x = math.sin(y)
    z = math.cos(y)
    series_sphere.add(
        x=x + random.uniform(-0.1, 0.1),
        y=y,
        z=z + random.uniform(-0.1, 0.1)
    )
    series_cube.add(
        x=-x + random.uniform(-0.1, 0.1),
        y=y,
        z=-z + random.uniform(-0.1, 0.1)
    )

chart.open()
Box Series
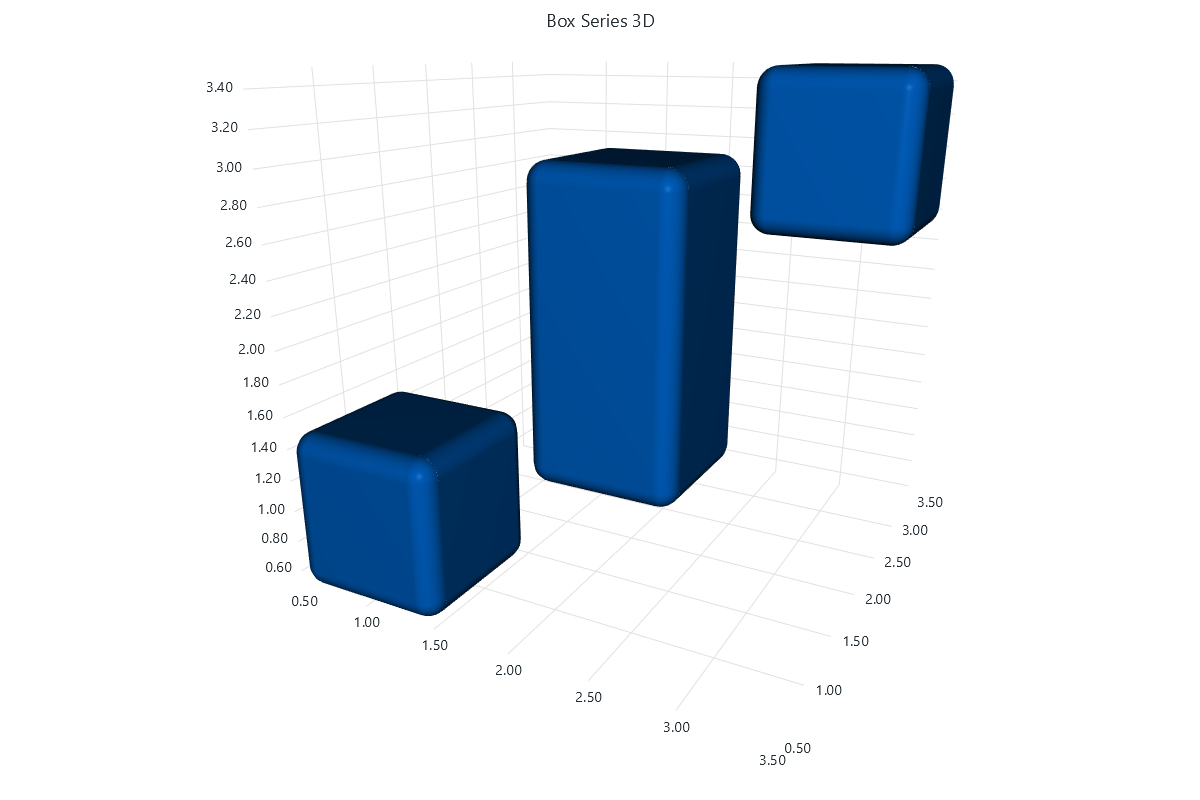
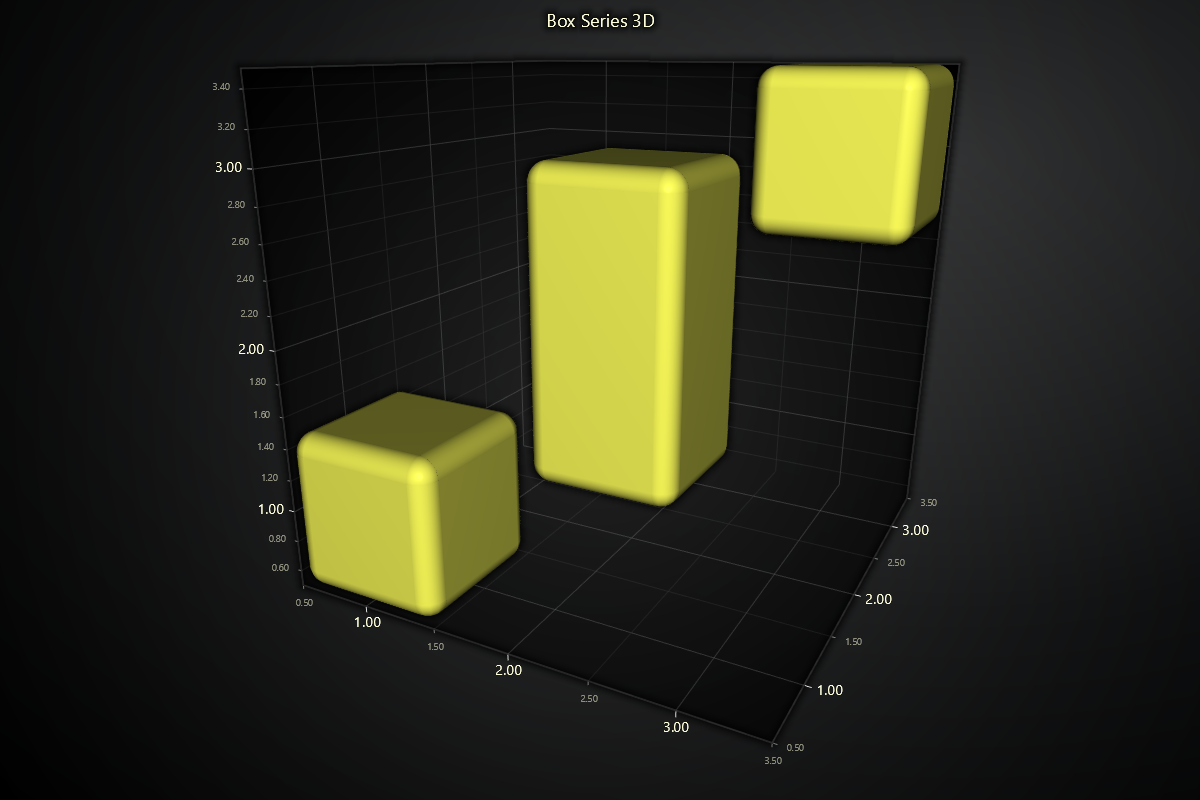
import lightningchart as lc

lc.set_license('my-license-key')

box_data = [
    {
        "xCenter": 1, "yCenter": 1, "zCenter": 1,  # coordinates of Box in Axis values.
        "xSize": 1, "ySize": 1, "zSize": 1  # size of Box in Axis values.
    },
    {
        "xCenter": 2, "yCenter": 2, "zCenter": 2,
        "xSize": 1, "ySize": 2, "zSize": 1
    },
    {
        "xCenter": 3, "yCenter": 3, "zCenter": 3,
        "xSize": 1, "ySize": 1, "zSize": 1
    }
]

chart = lc.Chart3D(
    theme=lc.Themes.White,
    title='Box Series 3D'
)
series = chart.add_box_series().add(box_data)
chart.open()
Surface Grid Series
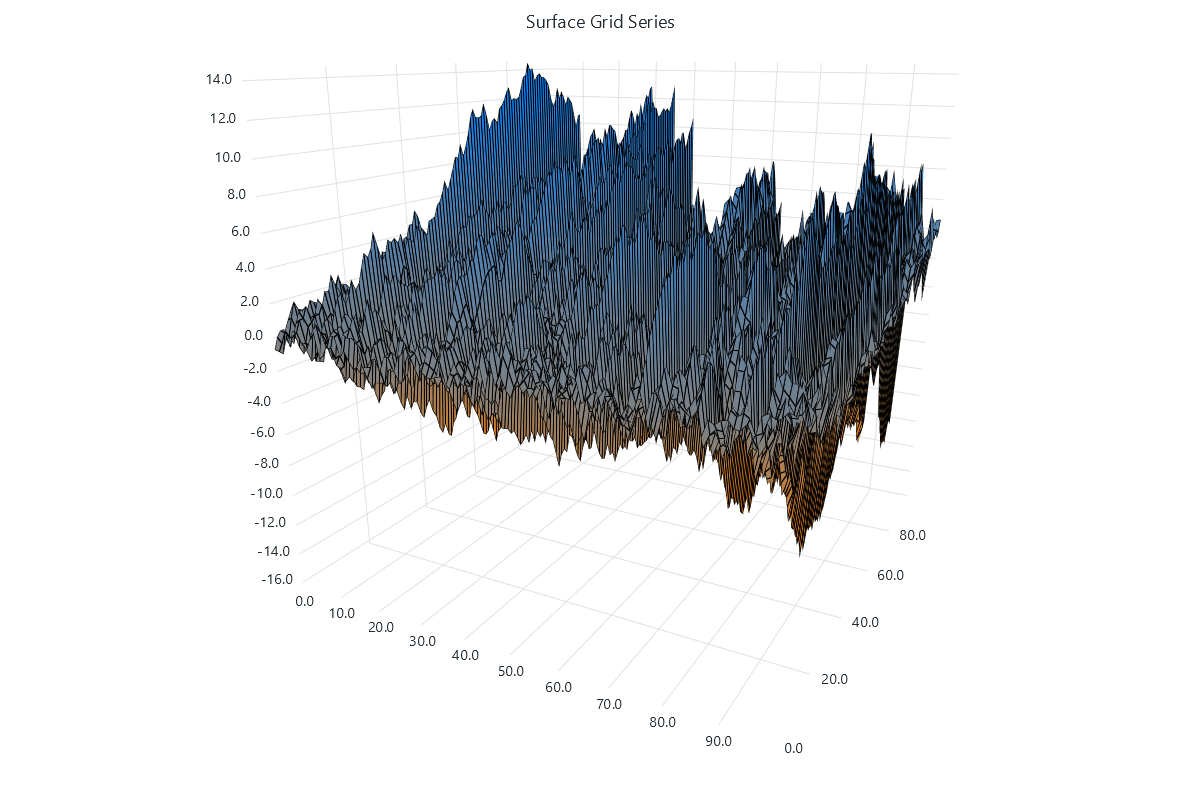
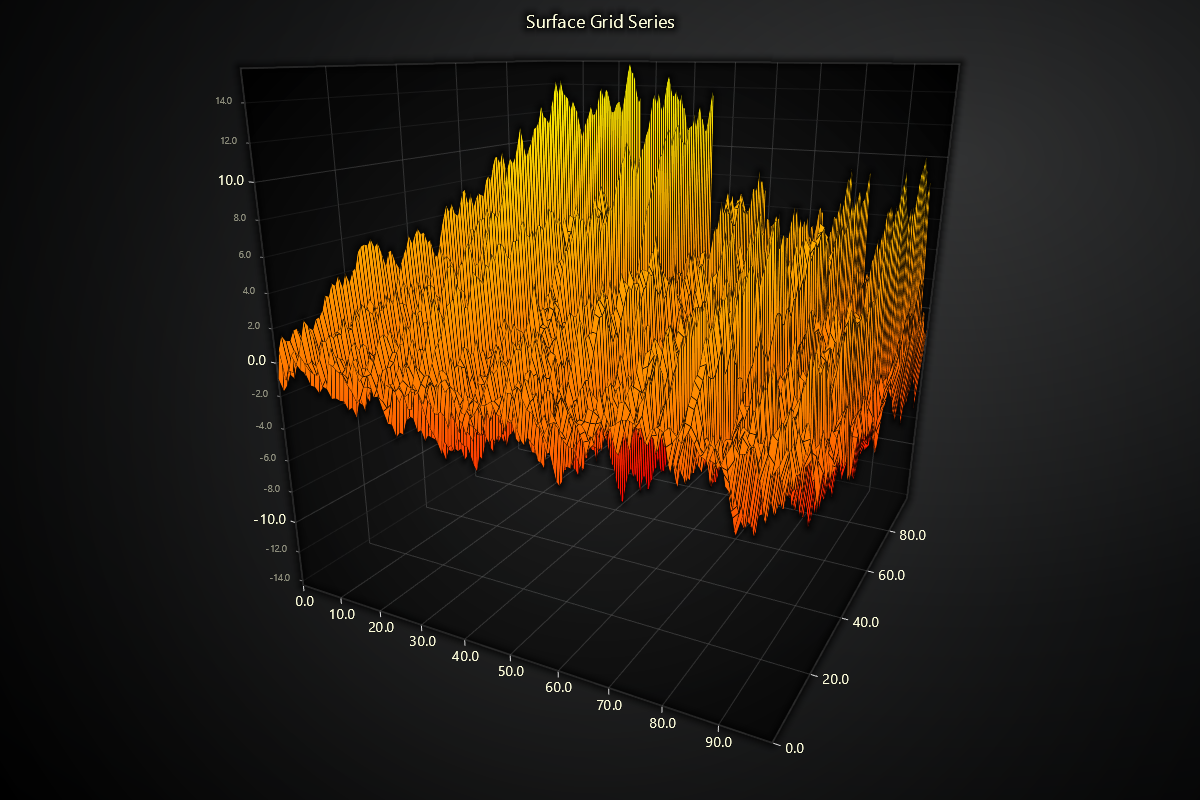
import lightningchart as lc
import random

lc.set_license('my-license-key')

columns_amount = 100
rows_amount = 100

surface_data = []
for i in range(rows_amount):
    row = []
    value = 0
    adjacent_value = 0
    for j in range(columns_amount):
        if i > 0:
            adjacent_value = surface_data[i - 1][j]
        value = value + (random.random() * 2) - 1
        row.append(value)
    surface_data.append(row)

chart = lc.Chart3D(
    theme=lc.Themes.White,
    title='Surface Grid Series'
)
series = chart.add_surface_grid_series(columns=columns_amount, rows=rows_amount)
series.invalidate_intensity_values(surface_data)
series.invalidate_height_map(surface_data)
series.set_palette_colors(
    steps=[
        {'value': 0.0, 'color': lc.Color(255, 128, 0)},
        {'value': 1.0, 'color': lc.Color(0, 128, 255)},
    ],
    look_up_property='value',
    percentage_values=True
)
chart.open()
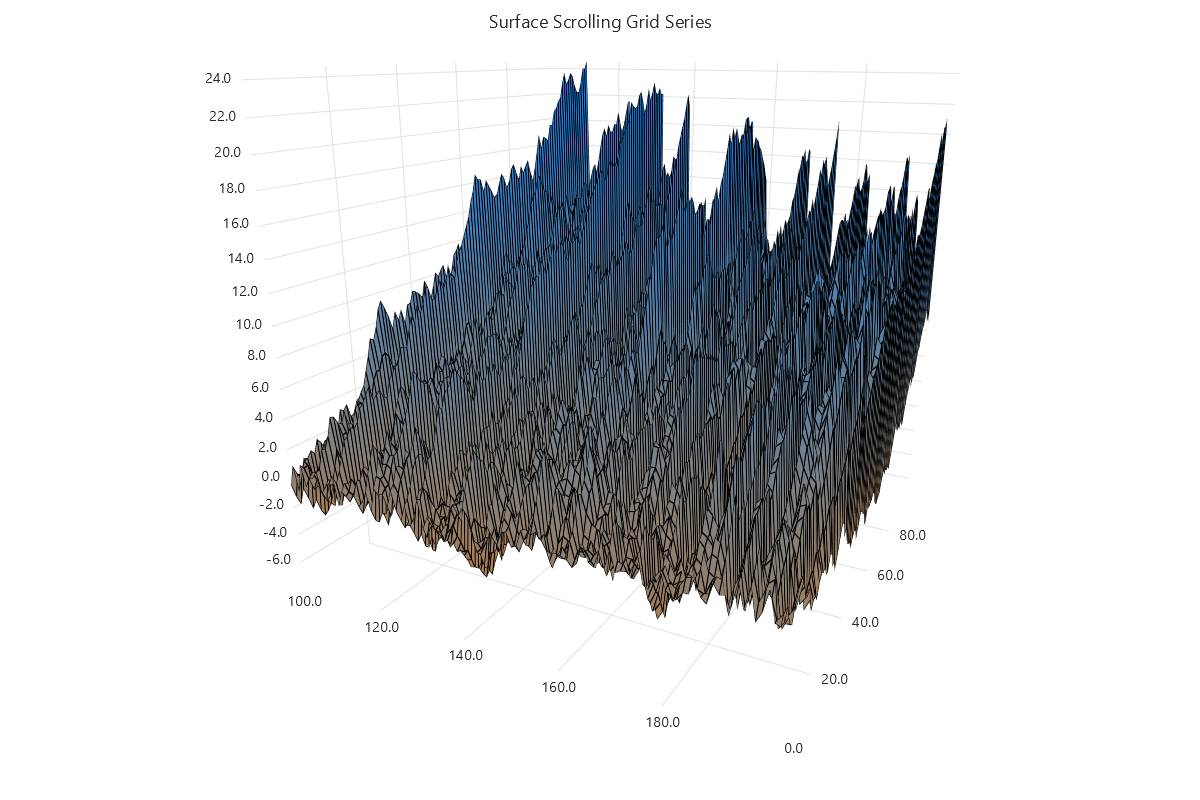
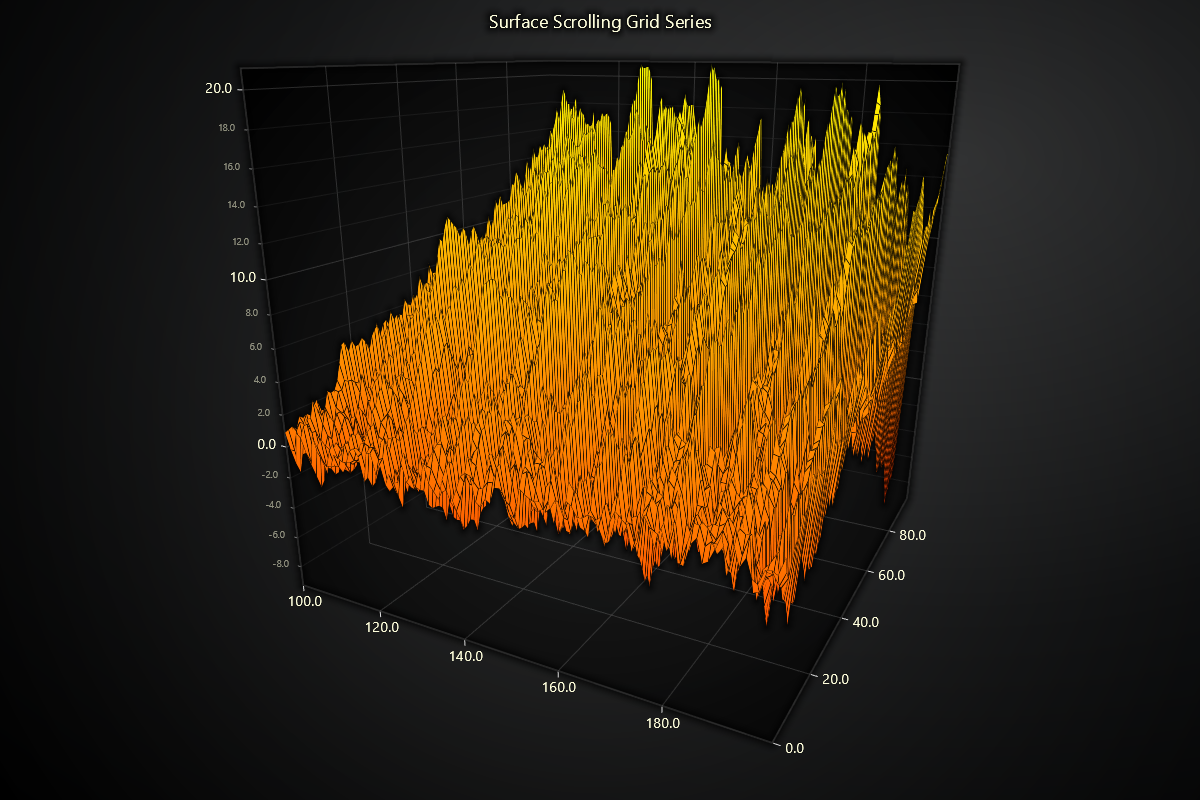
Surface Scrolling Grid Series
import lightningchart as lc
import random
import time

lc.set_license('my-license-key')

columns_amount = 100
rows_amount = 100

surface_data = []
for i in range(rows_amount):
    row = []
    value = 0
    adjacent_value = 0
    for j in range(columns_amount):
        value = value + (random.random() * 2) - 1
        row.append(value)
    surface_data.append(row)

chart = lc.Chart3D(
    theme=lc.Themes.White,
    title='Surface Scrolling Grid Series'
)
series = chart.add_surface_scrolling_grid_series(
    columns=columns_amount,
    rows=rows_amount
)
series.set_palette_colors(
    steps=[
        {'value': 0.0, 'color': lc.Color(255, 128, 0)},
        {'value': 1.0, 'color': lc.Color(0, 128, 255)},
    ],
    look_up_property='value',
    percentage_values=True
)
series.add_values(y_values=surface_data, intensity_values=surface_data)

chart.open(live=True)

for i in range(500):
    row = []
    value = 0
    for j in range(columns_amount):
        value = value + (random.random() * 2) - 1
        row.append(value)
    new_data = [row]
    series.add_values(y_values=new_data, intensity_values=new_data)
    time.sleep(0.01)

chart.close()