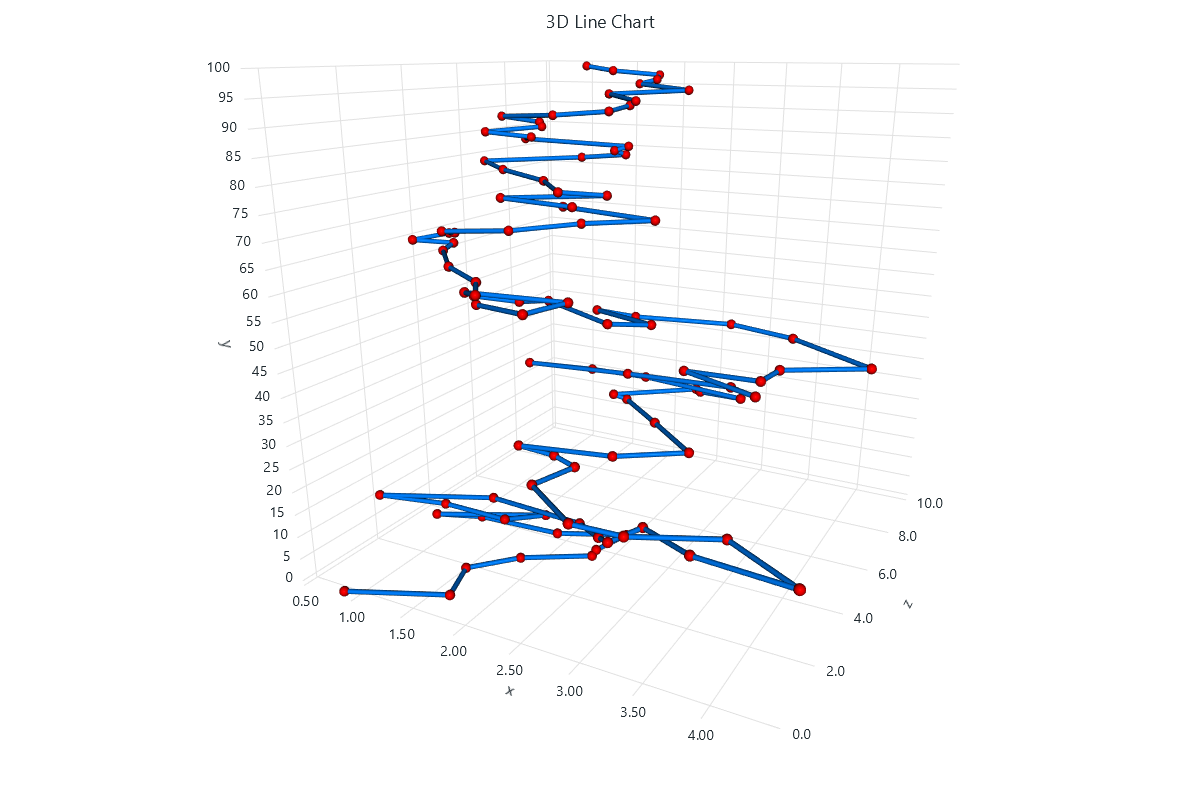
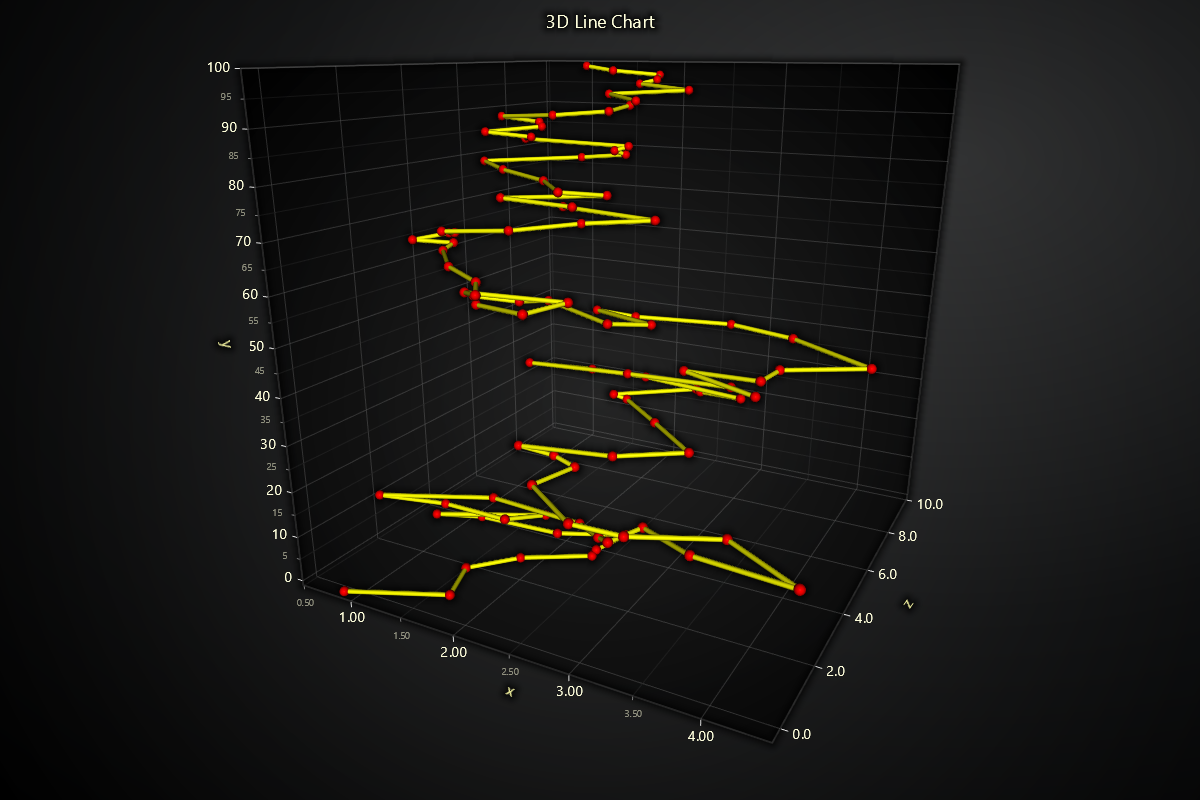
3D Line Chart
Series type for visualizing a collection of x, y, z coordinates by a continuous line stroke.
import lightningchart as lc
import random

lc.set_license('my-license-key')

x_values = []
y_values = []
z_values = []

x = 0
z = 0
for y in range(100):
    x += (random.random() * 2) - 1
    z += (random.random() * 2) - 1
    x_values.append(x)
    y_values.append(y)
    z_values.append(z)

chart = lc.LineChart3D(
    x=x_values,
    y=y_values,
    z=z_values,
    line_type='pointline',
    line_color=lc.Color(0, 128, 255),
    line_width=6,
    point_type='sphere',
    point_color=lc.Color(255, 0, 0),
    point_size=12,
    theme=lc.Themes.White,
    title='3D Line Chart',
    xlabel='x',
    ylabel='y',
    zlabel='z'
)
chart.open()