


RoadMap code


Roadmap
.NET
JS
JS Trader
Python
Python Trader
Previous years
Next years
2008
Development start
2009
V.1
WinForms publishing
2013
V.5
WPF publishing
2017
V.8.0
Volumetric Rendering

2018
Free Non-Commercial LightningChart License for students
2019
Q4
V.8.5
New DevCenter application and license management
2020
Q1
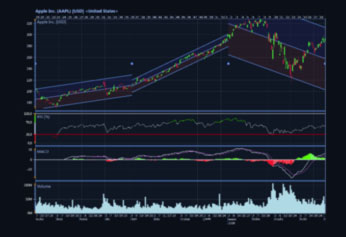
Trader
Easy trading charts with technical indicators built-in
Q2
v 9.1.1
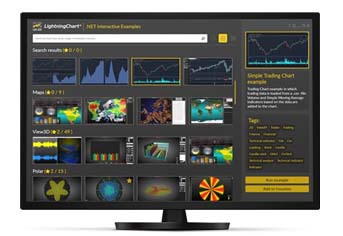
Interactive Examples App released
Q2
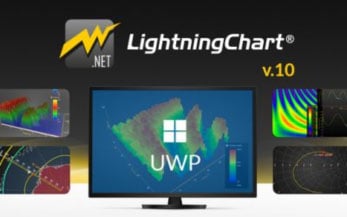
v.10
UWP charts, trader for WinForms
Q4
New Technical Indicators in Trader
2021
Q2
v.10.1.1
16 billion data points in real-time!
Q4
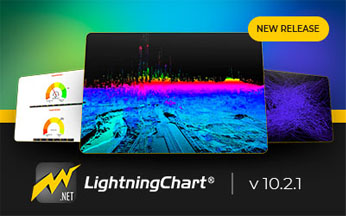
v.10.2
LightningChart .NET v.10.2.1 focuses heavily on compatibility improvements
2022
Q2
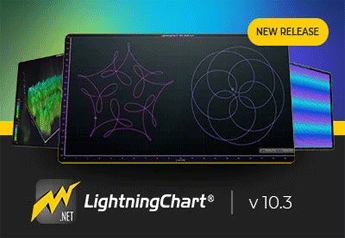
v.10.3.1
DigitalLineSeries, 1 TRILLION data points, new themes.
Q3
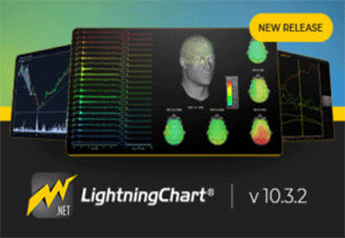
v.10.3.2
New technical indicators and drawing tools, EEG visualization and more...
2023
Q1
v.10.4.1
New DataCursor for automated data tracking. ViolinPlot and ZoomBar components. Signal processing component.
Q2
v.10.5.1
DataCursor, 3D TransparencyRenderMode feature, LightningChart .NET target framework updated to .NET framework 4.6.2
2024
Q1
v.11.0.1
New .NET Framwork target to v.4.8 and v.6.0. DPI awareness, Interactive Examples improvements.
Q2
v.12.0
ImageLayer, IntensityGridSeriesPolar series, DataCursor improvements, 3D TransparencyRenderMode.

Q4
v.12.1.1
HexagonShape, 3D Interactions, ValueRangePalette, VolumeModel Binding, & zooming behavior for XY block-line-series improvements

2025
Q1
v.12.2.1
New .NET Framwork target to 8.0. HERE Maps service Raster Tile API v3. IEs app improved UI, new charts.

Q2
v.12.3.1
Line-drawing precision, HERE maps quality improvement, new Volumetric model, LiDAR chart.

Q4
v.12.4.1
DataCursor, Annotation, palette, LegendBox, and .NET Trader new UI.


Previous years
Next years
2017
Development start
2020
Q2
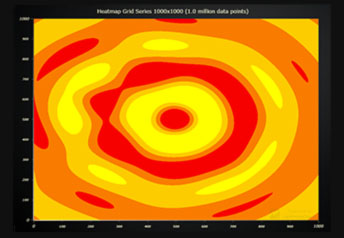
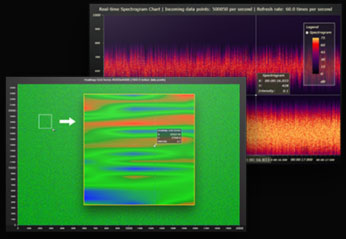
v 1.3 Heatmaps and Spectrograms
Heatmaps, constant lines, bands, etc.
Q2
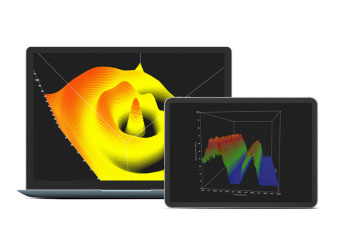
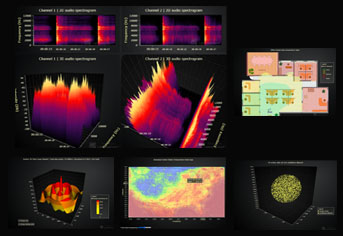
v 2.0 3D Charts
3D charts for JavaScript
Q4
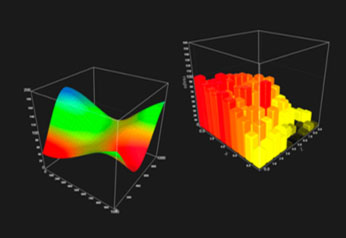
v 2.1 Advanced 3D charts
Custom themes: 3D box series, 3D surface series
2021
Q2
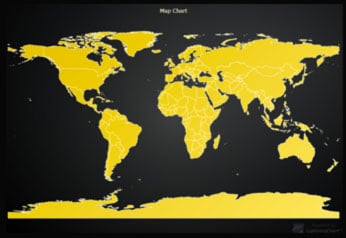
v 3.1 Polygons + Maps
Vector geographic maps, with value based coloring
Q2
v 3.2
Huge breakthrough in heatmaps performance
Q4
v 3.3
Five new charts added + breakthrough performance in Surface grid charts
2022
Q1
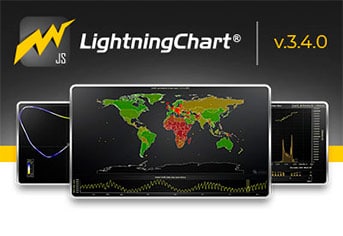
v 3.4
Palleted lines + new Covid-19 Map ChartsSupport for data gaps & line charts improvements
2023
Q1
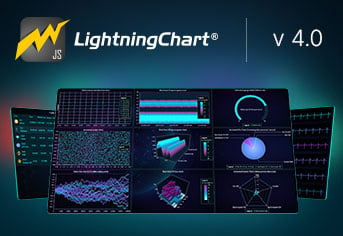
v 4.0
Beautiful charts, introducing the DataGrid component, new color Themes, and more.
Q2
v 4.1
Dashed lines, custom ticks in 3D charts, flat themes & no-code editor, no-code themes editor, visual imprvements.
Q3
v 4.2
Polar heatmaps, bar charts, coordinate translations, developer documentation
Q4
v 5.0
WebGL Context Sharing, point-shape types, auto-cursors, performance improvements, licensing changes.
2024
Q1
v 5.1
Introducing Mesh Model 3D, new Beta features, new react-time-series-chart component, improved LUT position.
Q2
v 5.2
Introducing Stacked Axes, a new XY series experience, Treemaps, textured point series, gradients and effects for custom themes.

Q3
v 6.0
Multi-series, 3D, and Point Cloud cursors. Rework gauge charts, new XY axis features, NPM organization rename.

Q4
v 6.1
Parallel Coordinate Chart, Orthographic 3D projections, extended Dashed Line support, Developer Experience Improvements.

2025
Q1
v 7.0
setUserInteractions, Text Series, ChartXY layout change event, visual quality improvements, new chart examples.

Q2
v 7.1
Nanosecond timestamps, HTML Text Rendering, Real-time scrolling axis, New axis fitting modes, new chart examples.

Q3
v 8.0
Legends rework, 8x better performance, DataSetXY rework, PointStroke API, axis title positioning, LUT formatter.

Q4
v 8.1
Heatmap Min–Max Aggregation, Contour Rendering, 3D Line Coloring, Inset Custom Ticks & Cursor Styles.


Previous years
Next years
2023
Development start
2024
Q1
V.1
Introducing LightningChart JS comprehensive charting package to build industry-leading applications for finance and trading.

Q2
V.2
New UI, new chart types, new drawing tools, and bug fixes.

2025
Q1
V.3
UI changes and new features. Reworked zooming & panning. New events. Introducing Gann Box and Gann Fan Drawing tools.

Q2
V.3.1
Available via NPM. Transparent background support. Releasing enableMountainGradient() method. Bug fixes.

Q4
V.4.0
Price/indicator labels, drawing tool pointer events, improved real-time UX, automatic data sorting, and more.

Previous years
Next years
2024
Development start
Q1
Beta
Introducing Lightningchart Python beta for data analysis & software application development.

Q4
v.1.0
Official release of Lightningchart Python 1.0 featuring a high-performance graphics library for data science and software development.

2025
Q3
v.1.2
Enhanced axis configuration for bar charts. Support for adding Parallel Coordinate charts to dashboards.

Q4
v.2.0
Modification to legends, ChartXY Series Data API Improvements, Simplified scroll strategies, and more.

Q4
v.2.1
DataGrid, scrollable dashboards, new legend panels, heatmap min-max aggregations, and more.


