


Data Visualization Charts for the Transportation and Logistics Industry
Create data visualization apps for the transportation and logistics industry with LightningChart
Why Data Visualization Matters in Transportation and Logistics?
In the transportation and logistics sector, real-time data plays a critical role in optimizing operations, tracking shipments, and managing supply chains. With LightningChart’s high-performance chart components, businesses can gain actionable insights from large datasets through clear and responsive visualizations. This enhances decision-making, reduces delays, and boosts overall efficiency across logistics networks.
Tailored Solutions for Industry Needs
LightningChart offers specialized tools for industry-specific challenges, including route optimization, fleet tracking, and warehouse analytics. Whether you’re building a desktop solution with .NET or a cross-platform web app with JavaScript, LightningChart provides robust and customizable chart types to meet diverse operational needs. These tools are designed to support rapid rendering and smooth interactivity, even with vast and complex datasets.
LightningChart components for building Logistics applications
Developers can build powerful applications for the Transportation and Logistics industry by integrating LightningChart’s advanced data visualization tools using .NET or JavaScript components.
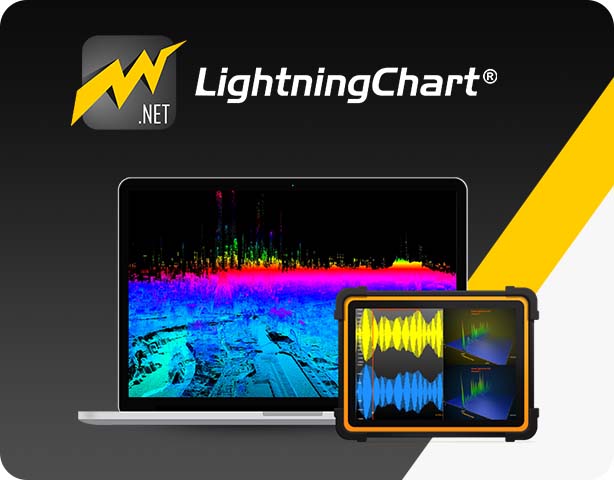
Discover LightningChart .NET Transportation and Logistics Charts
LightningChart .NET chart components can be integrated into applications that require data processing and visualization and there are 200+ charts available including 2D/3D, XY, Heatmaps, and more.
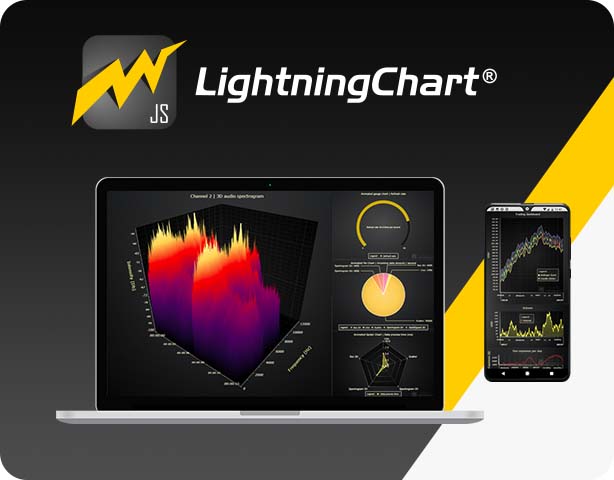
Transportation and Logistics Charts for JavaScript
Build cross-platform applications using LightningChart JS components featuring 100+ pre-built charts including business charts, line charts, DataGrids, GeoMaps, LiDAR, and more.
Build data visualization apps for the Transportation and Logistics industry using LightningChart

When using LightningChart for developing Transportation and Logistics applications, you ensure that your applications will feature the highest-performing chart components. LightningChart focuses on processing high volumes of data, fast loading speeds, high FPS rates, and advanced chart types. Chart components available include 2D & 3D charts, business charts, GeoMaps, XY series, DataGrids, and several more.
You are in good company
Read how LightningChart has helped these companies develop their applications


Get started with LightningChart Transportation and Logistics Charts
Continue learning with LightningChart

TutorialCreate a JavaScript Business Dashboard with LightningChart JS

TutorialCreate a JavaScript Radar & Spider Chart


If you have any questions, feel free to contact us!
©LightningChart Ltd 2026. All rights reserved.